
Your portfolio's best friend
Know what your portfolio
actually returned
Fidolio imports your Fidelity and Merrill Edge statements into an encrypted database on your own device, then answers the questions the brokerage app won’t: your money-weighted annual return, what your dividends really yield, what income is coming, and whether any of it beat inflation.
AndroidiOSmacOSWindowsLinux
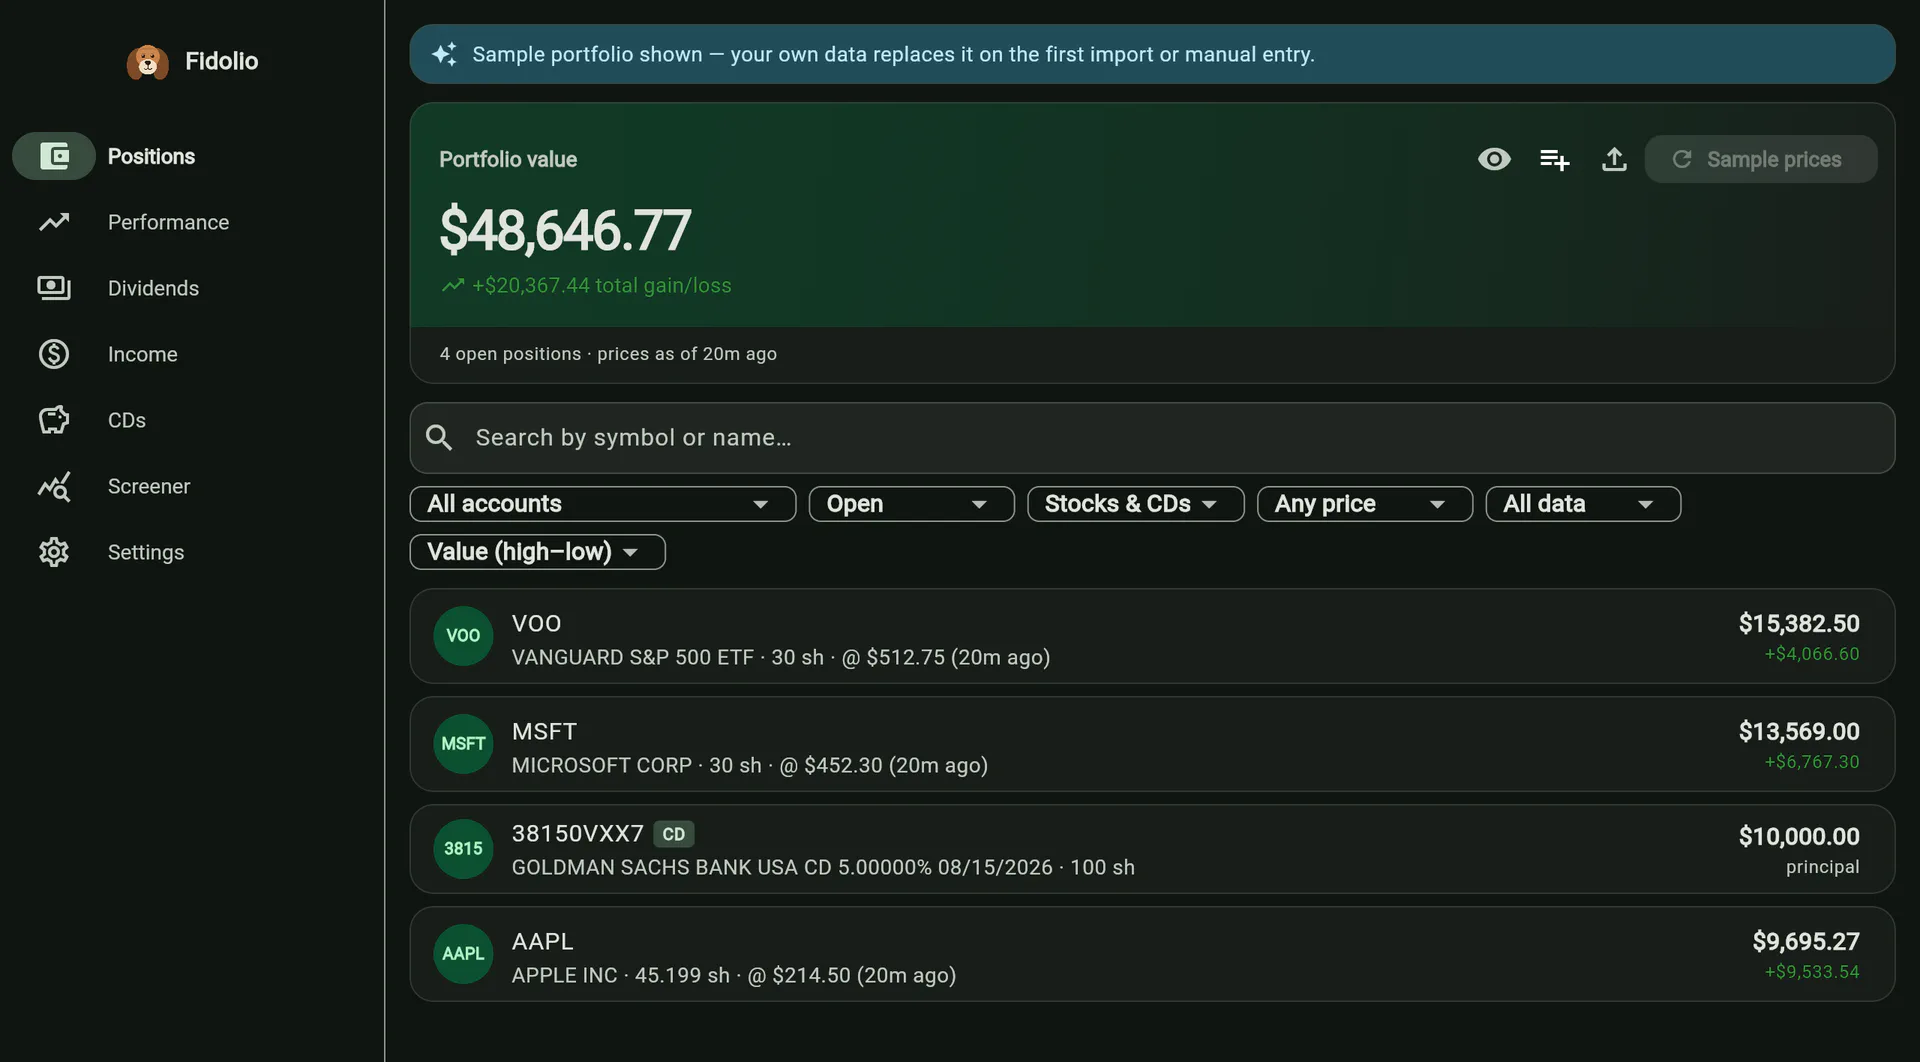
Everything a broker export leaves you to work out yourself
A statement tells you what happened. It does not tell you how you are doing. Fidolio reads the file, works out the rest, and keeps every number explainable.
Import, don't retype
Drop in a Fidelity account-history or Merrill Edge account-activity CSV. Fidolio detects the format, classifies every row, and skips anything it has already seen — so overlapping exports can be re-imported safely.
XIRR, not a guess
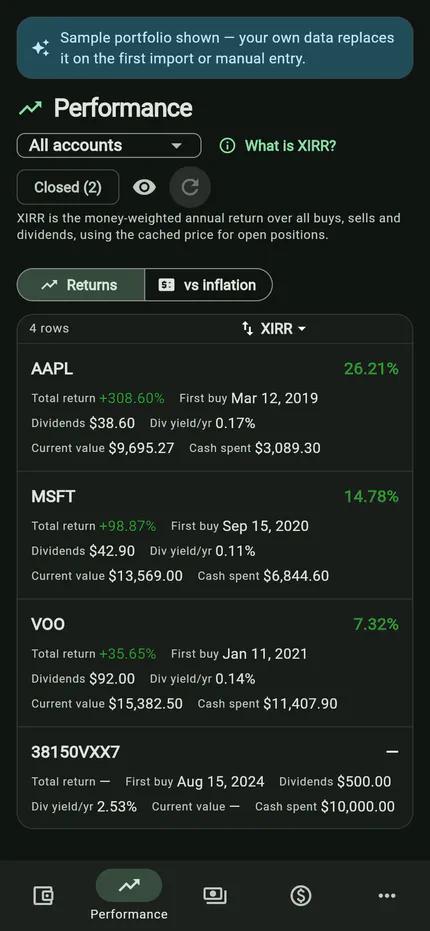
The money-weighted annual return over every buy, sell and dividend, dated. It is the number a spreadsheet’s XIRR gives you, computed per symbol and for the whole portfolio.
Dividends, properly counted
Reinvested and cash dividends split apart, yield on cost, forward yield, declared next payments, and a per-share payment history chart.
Income you can plan around
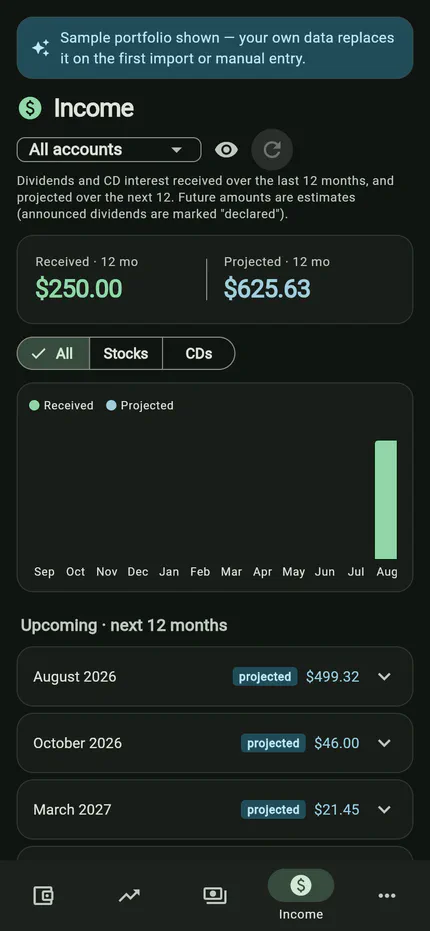
Twelve months received and twelve months projected, month by month — with announced dividends marked declared rather than estimated.
Certificates of deposit
Detected from the description, valued at principal rather than a market price they do not have, and returning interest instead of a capital gain.
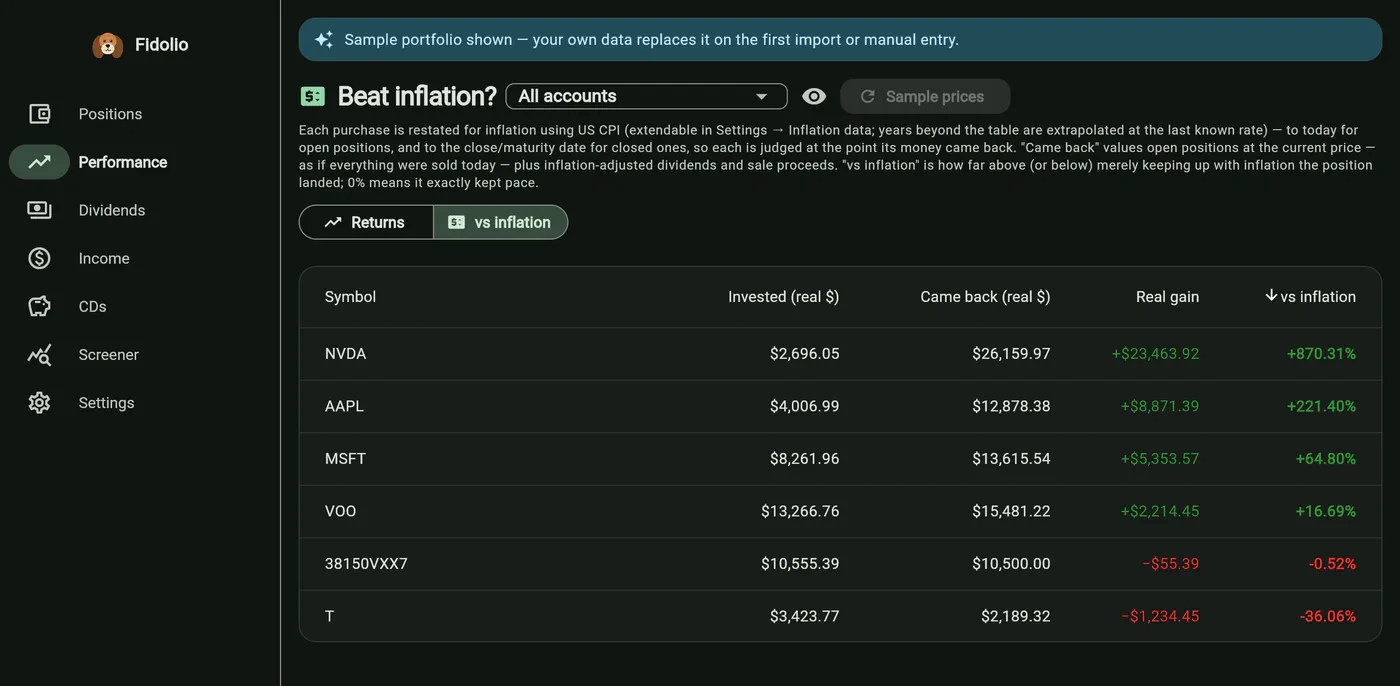
Beat inflation?
Every purchase restated in today’s dollars against a bundled US CPI-U series, so a 6% nominal return in a 4% year reads as what it was.
Research before you buy
A screener that grades candidates on published filings and ratios, plus fundamentals, analyst estimates, financial statements and a DCF on every stock page.
Encrypted, local, yours
AES-256 at rest, unlocked by a master password or biometrics. No account, no server, no telemetry — your holdings never leave the device.
A tour of the app
Every screenshot below is the real app running its built-in sample portfolio. Click any of them to see it full size.
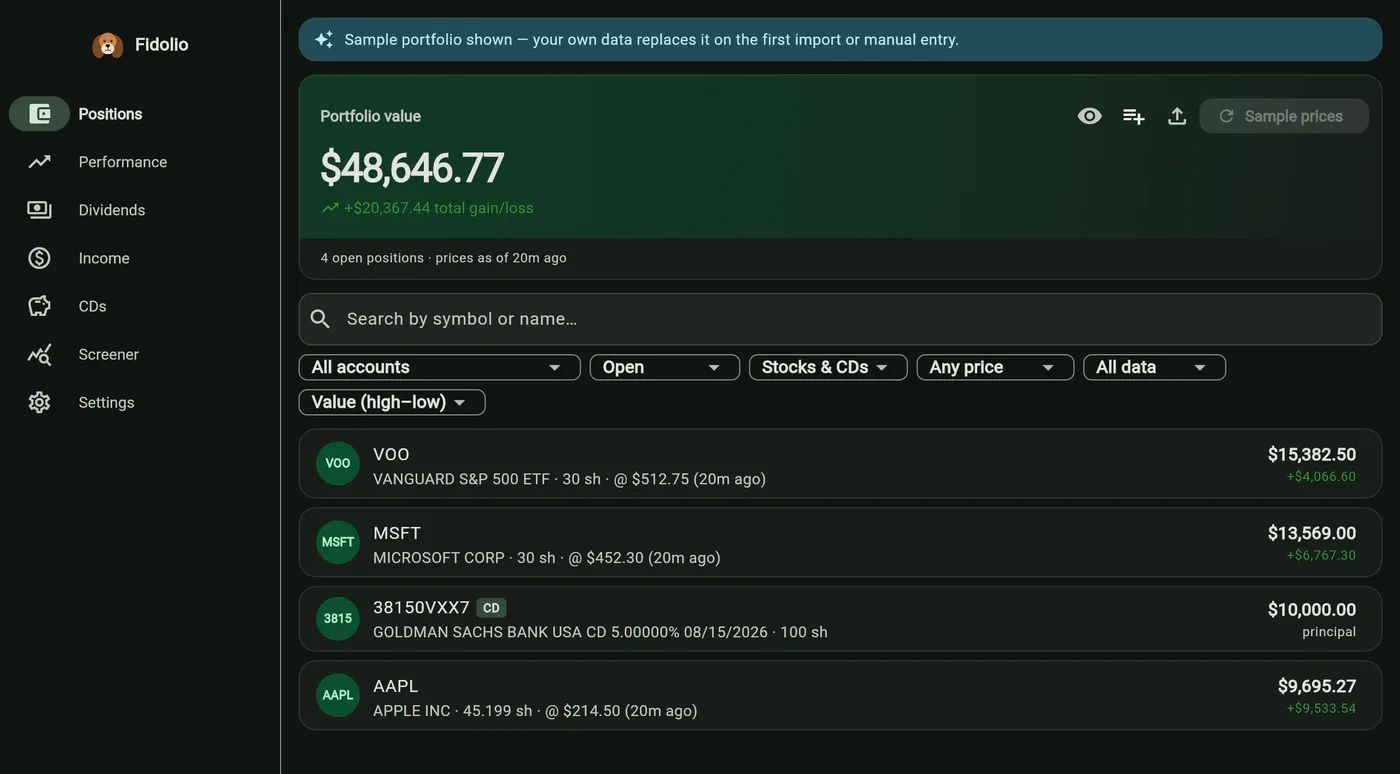
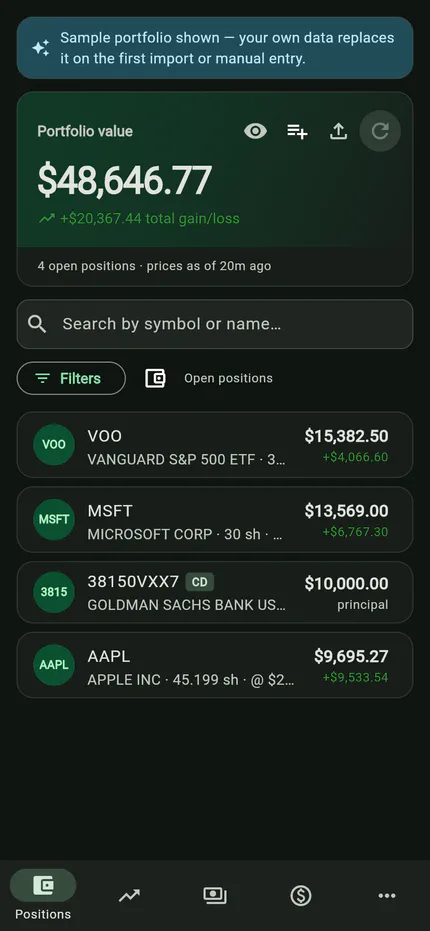
Every holding, across every account
One list of what you own, valued at the current price, with the total gain/loss on top. Accounts aggregate by default — 100 shares in the IRA and 50 in the brokerage are one holding of 150 — and a picker narrows every screen in the app to one account at once.
- Search, plus filters for open/closed, stock/CD, priced/unpriced and data completeness
- A ⚠️ badge where the statements do not reach far enough back to explain a balance
- Watchlist symbols you don’t own yet, tracked alongside the ones you do
Drop in a CSV. Keep dropping them in.
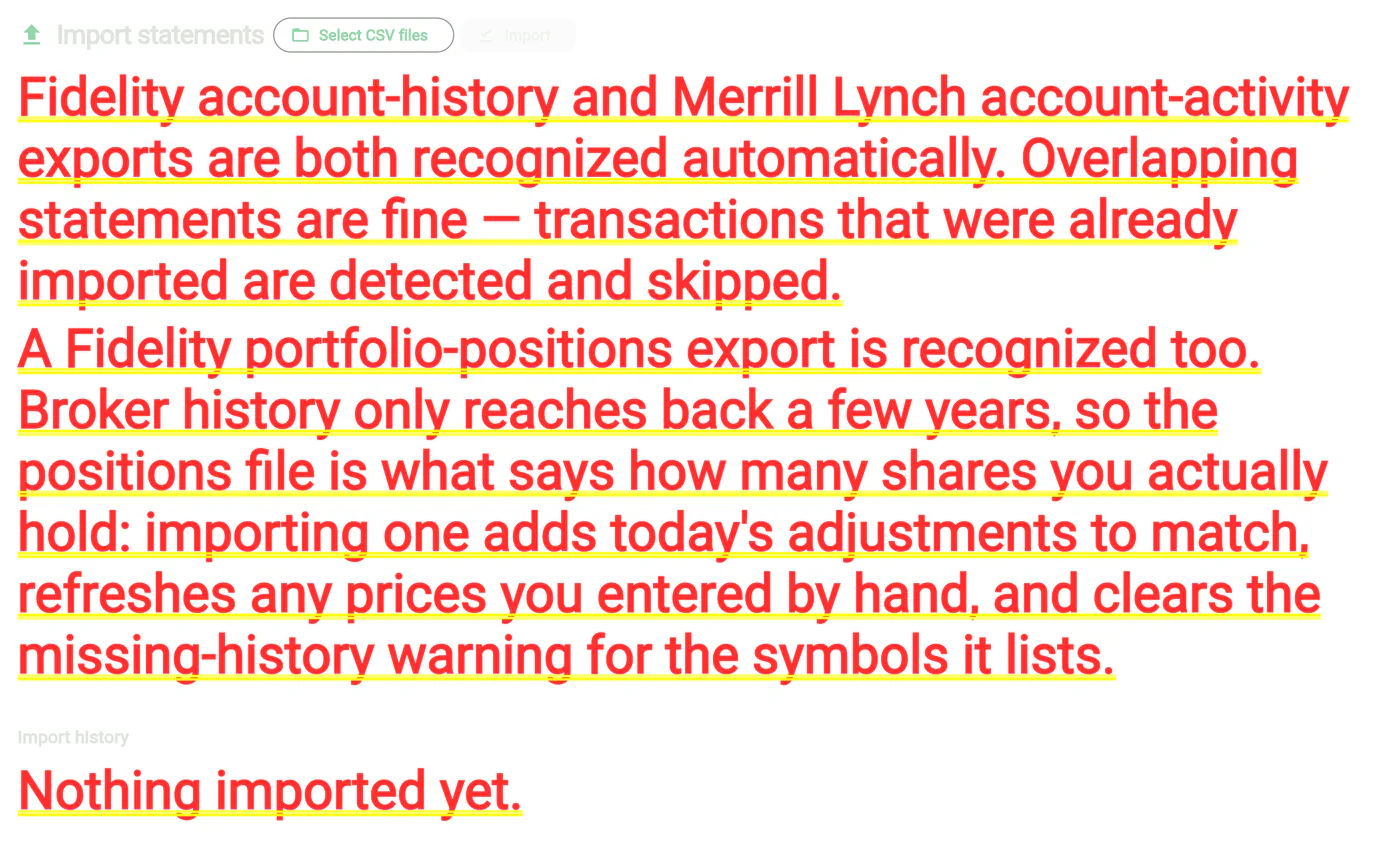
Fidolio reads Fidelity account-history and Merrill Edge account-activity exports, detects which is which from the file itself, and classifies every row — buy, sell, dividend, reinvestment, interest, fee, transfer. Overlapping exports are safe to re-import: anything already stored is skipped.
- No format to pick and no column mapping to configure — the header identifies the file
- Duplicate detection by row identity, so a re-download of last quarter adds nothing
- A Fidelity portfolio-positions export reconciles balances the history cannot reach
One page per holding, and it explains itself
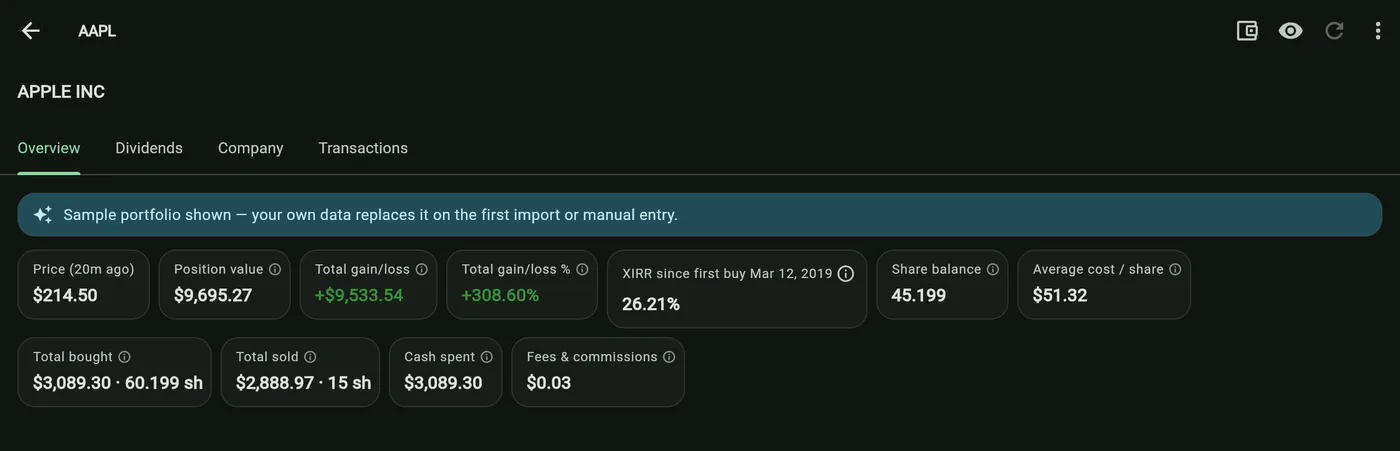
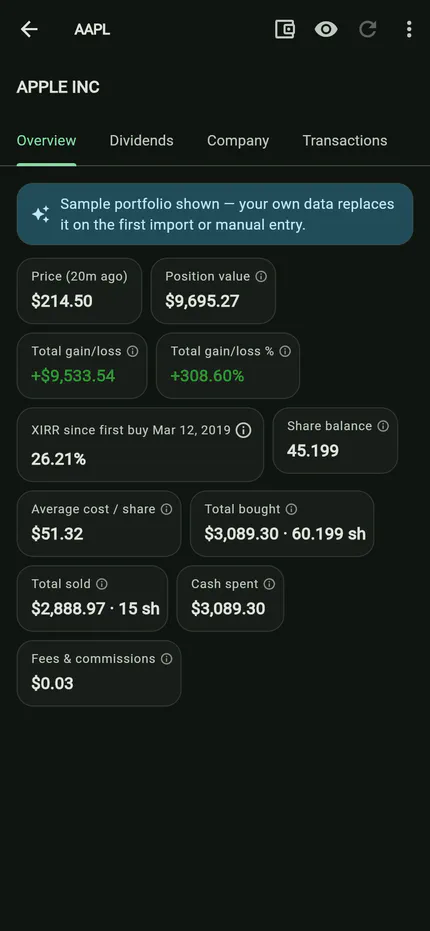
Tap any row and you get the whole story of one position: price and day change, position value, gain/loss in dollars and percent, XIRR since the first buy, share balance, average cost, what you bought, what you sold, and every fee. Tabs beyond that carry dividends, company research and the full transaction history.
- Every figure has an ⓘ opening a written explanation — what it is, what counts as normal, and where it misleads
- A price chart overlaid with your own buys and sells, at the price you actually paid
- Set a price by hand when no quote exists, and it flows into every total in the app
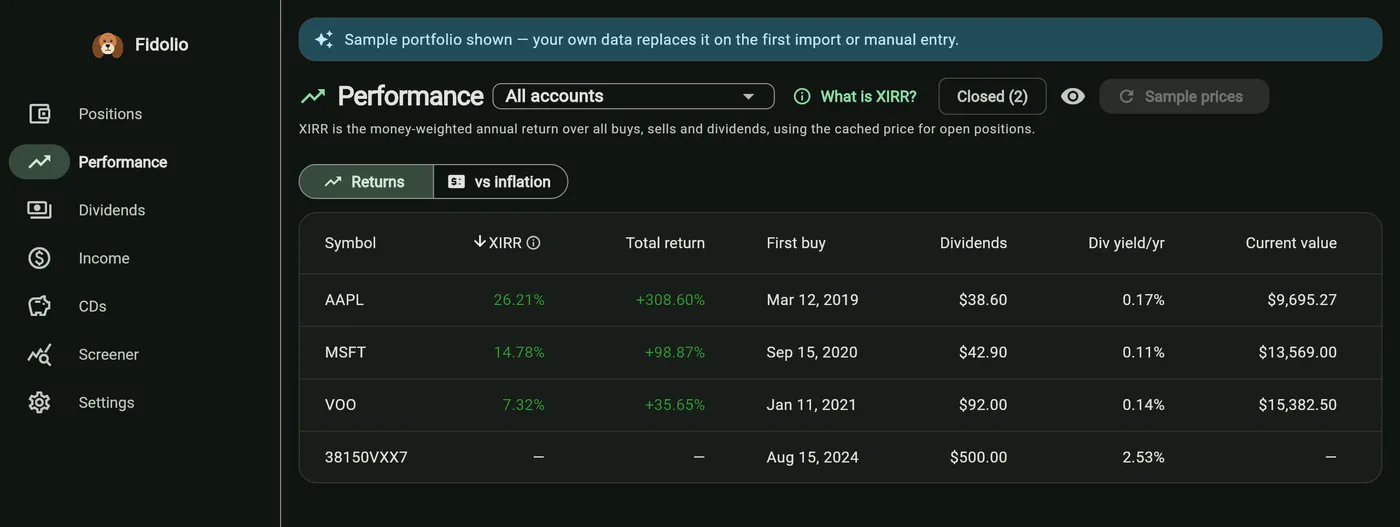
The return that accounts for when you invested
A percentage gain says nothing about time, and an average annual return says nothing about how much was invested when. XIRR — the money-weighted internal rate of return over every dated cash flow — answers both, and Fidolio computes it per symbol and for the portfolio.
- Every buy, sell, dividend, interest payment and fee, on its own date
- Sorted, sortable, and filterable to one account
- Called XIRR everywhere, never CAGR — they are different claims
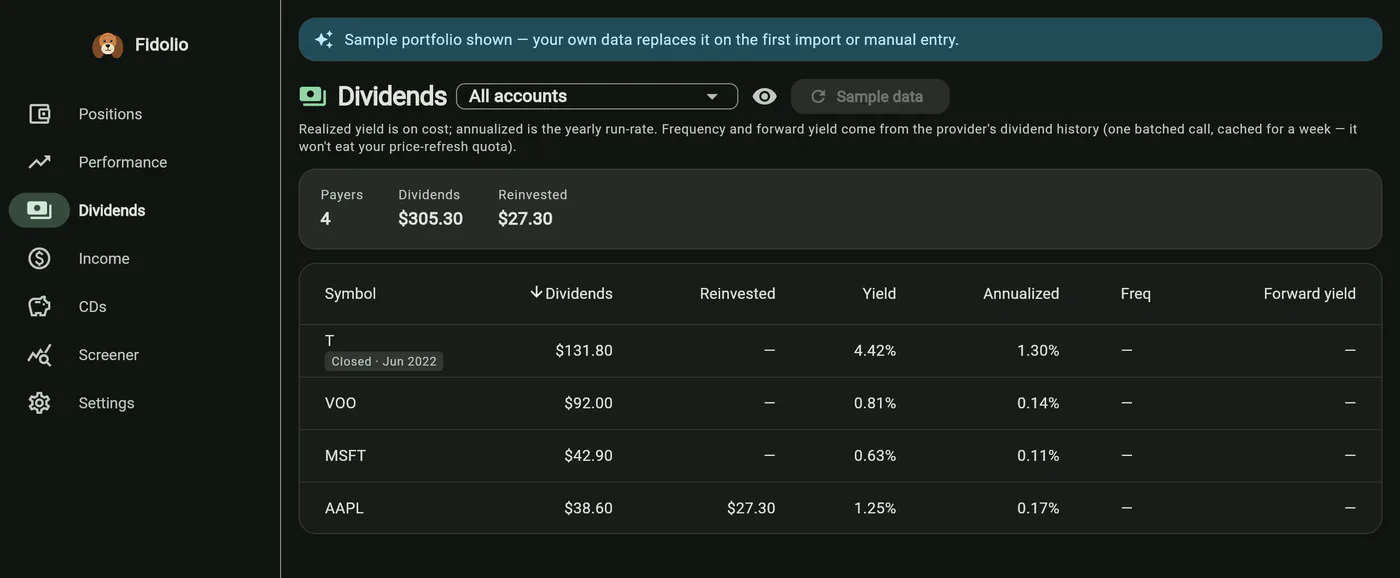
What your dividends actually yield
Total received, yield on cost, and an annualised rate that refuses to extrapolate a short holding into a number it cannot support. Reinvested and cash dividends are counted apart, because they are different things that a broker statement reports as two rows.
- One $11.66 payment 70 days into a position is not a 6%/yr run-rate, and Fidolio will not say it is
- Declared next payments where the provider announces them, marked as declared rather than estimated
- Per-share payment history and received-by-year charts on every stock page
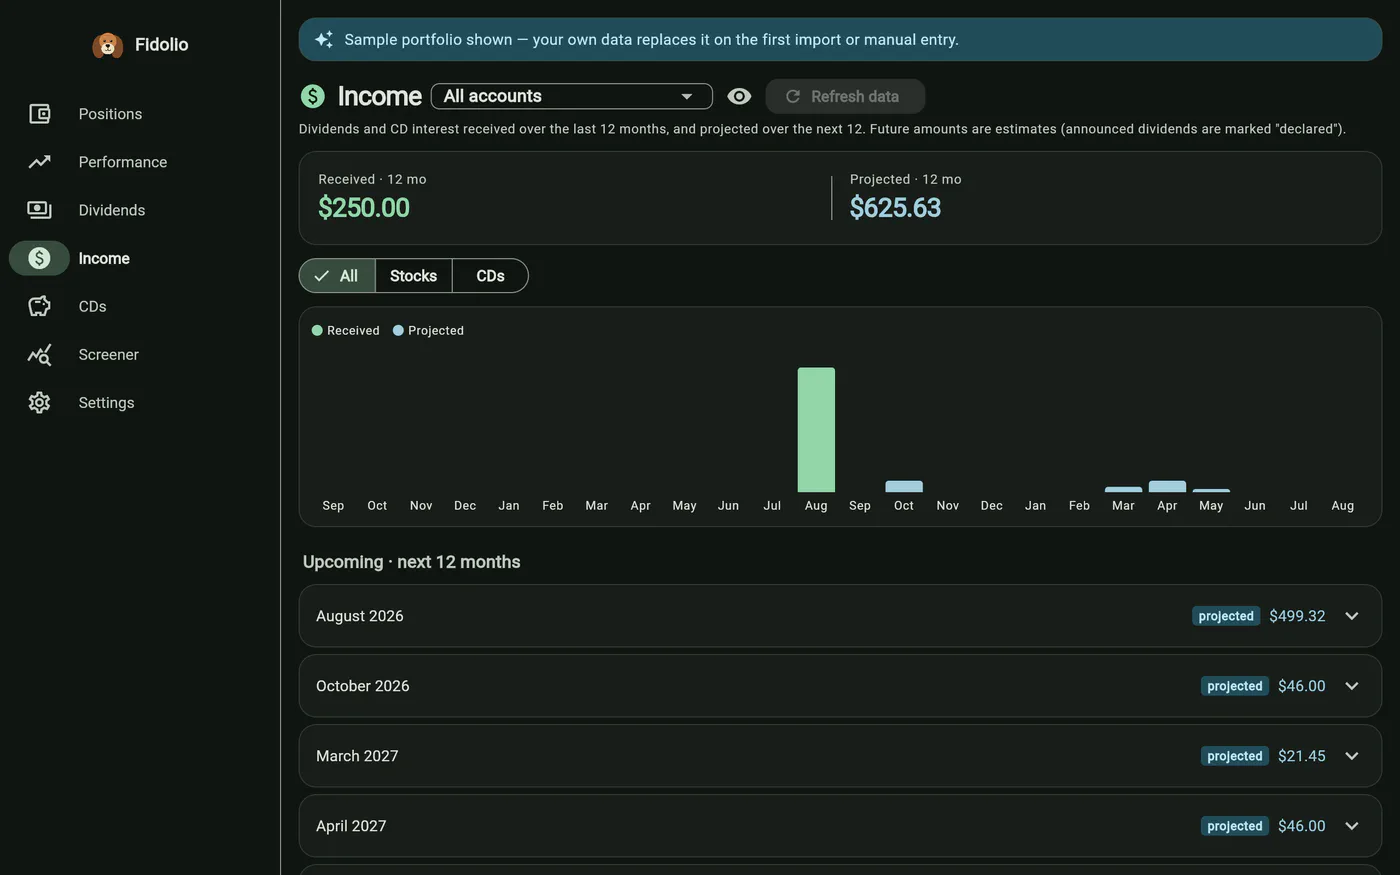
Twelve months back, twelve months forward
Dividends and CD interest received over the last year, and what is expected over the next one, in the same view and the same chart. Announced dividends are marked declared; everything else is labelled as the projection it is.
- Month-by-month bars across the full 24-month span, received and projected side by side
- Expandable month cards listing each individual payment
- Each held CD contributes one event at maturity — remaining interest plus the principal coming back
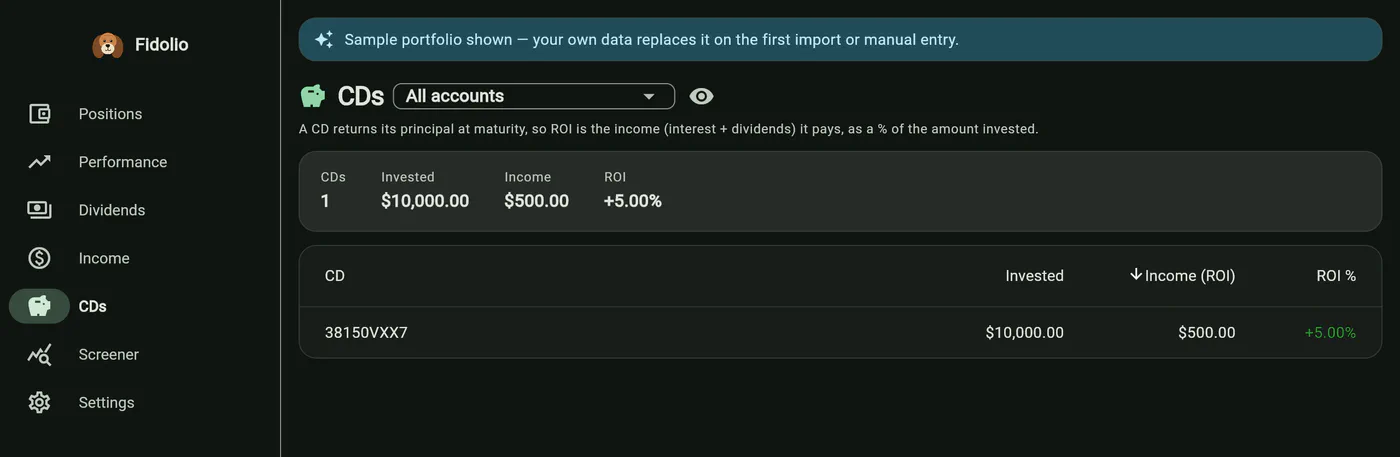
CDs, valued as CDs
A certificate of deposit has no market price, returns its principal at maturity, and earns its return as interest. Treating it like a stock produces nonsense in every metric, so Fidolio detects it from the description and handles it apart — with a tab of its own.
- Held at principal, not at a price a quote API cannot supply
- ROI is the income it pays, as a percentage of what was invested
- Excluded from price refreshes, so it never burns an API request or reports a failure
Did any of it actually beat inflation?
Every purchase restated in reference-date dollars against the US CPI-U, against what the position is worth now plus its inflation-adjusted dividends and sale proceeds. A factor of 1.00× means the money exactly kept pace; anything less means the position lost real ground while its nominal figure looked positive.
- CPI-U bundled in, so it works offline, costs no API budget and cannot change under you between two refreshes
- Closed positions are judged at their close date, not today — the money came back then
- Extendable in Settings for years past the bundled table
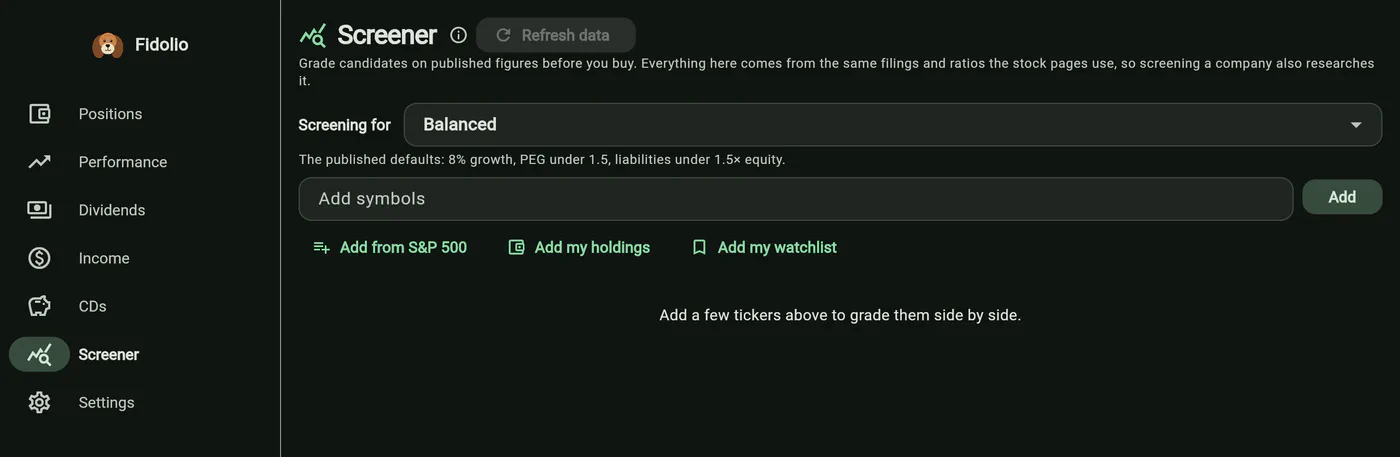
Grade a candidate before you buy it
The one screen that is not a view of your portfolio. It grades companies you deliberately do not own against a five-point checklist built from published filings and ratios — and ranks them against the holdings you would have to sell to buy them.
- Four named goal profiles — balanced, growth, income, value — not sliders to tune until you get the answer you wanted
- A criterion with no input abstains; it is never scored as a failure
- Piotroski F-Score and Altman Z″ ride along at no extra request
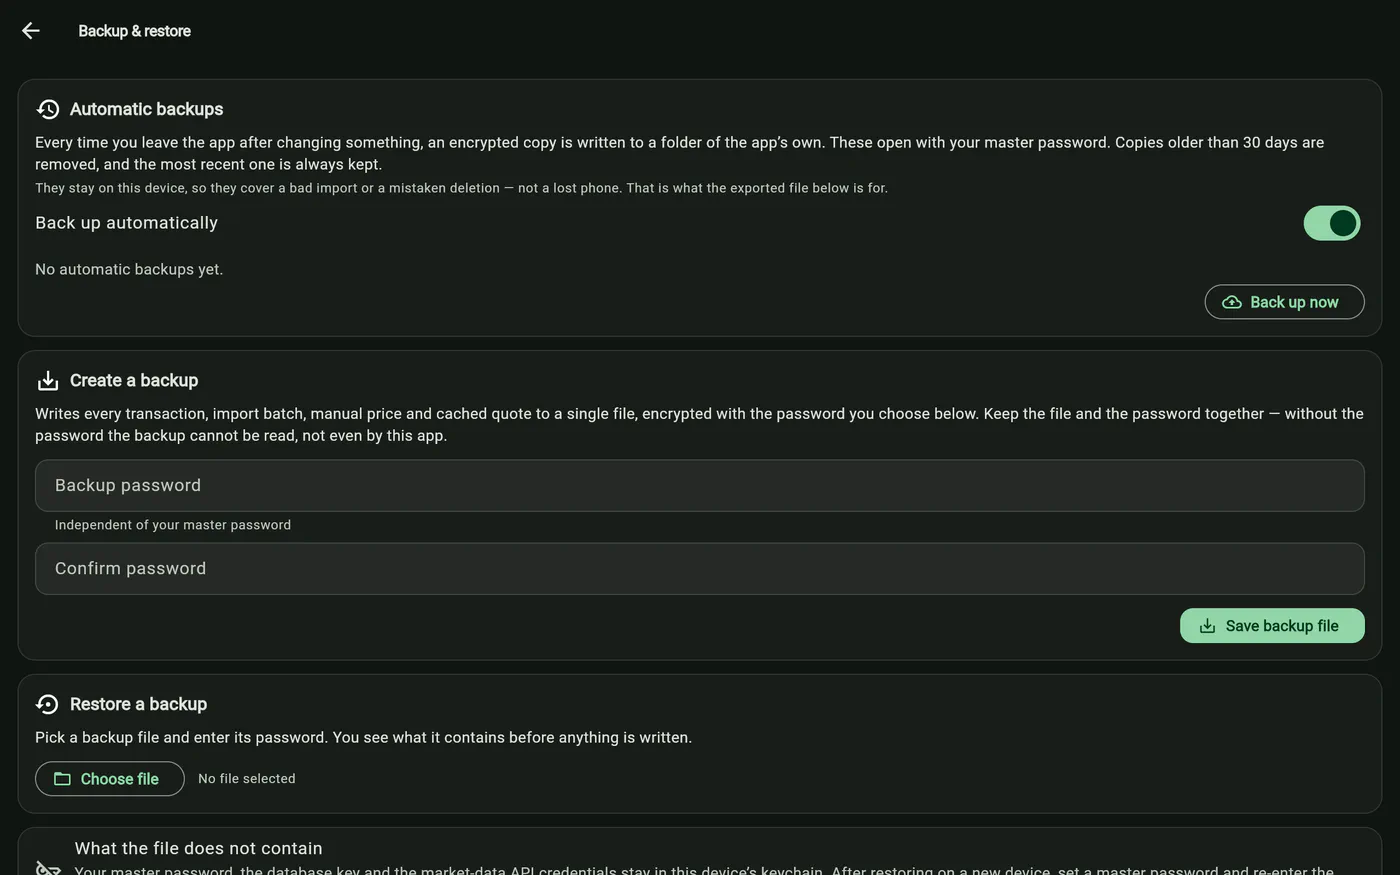
Automatic backups, encrypted, on your device
The database is encrypted with a key derived from your master password. Lose both the password and the keychain entry and the data is gone — so Fidolio writes an encrypted backup every time you leave the app after changing something, and can export the whole portfolio to one password-protected file.
- Automatic, in the app’s own folder, kept 30 days — and the newest is kept however old it is
- One encrypted JSON file for the manual export, readable on any device with the password
- Restore merges by default, or replaces the lot for a new device
The same portfolio, in your pocket
One codebase, five platforms. On a phone the tables become tappable cards, the filters collapse into a sheet, and the navigation rail becomes a bottom bar — the same data, laid out for the screen it is on.
Where the numbers come from
Prices need one free API key, and there are four vendors that will give you one. After that you choose, per kind of data, which of them answers — because “can I pay for one of these and use it for everything?” should depend on your subscription, not on how the app was wired.
Every kind of market data is a capability, independent of who supplies it. Each one resolves live, from three things: which credentials exist, which keys you have marked as paid, and which vendor you have pinned. Saving a key or changing a pick takes effect on the next refresh.
| Quotes | Bars | Divs | Fundamentals | Targets | Ratings | Estimates | Profile | Statements | Rates | Peers | Insiders | |
|---|---|---|---|---|---|---|---|---|---|---|---|---|
| SEC EDGAR (no key) | ✓ | ✓ | ||||||||||
| Alpaca | ✓ | ✓ | ✓ | |||||||||
| Finnhub | ✓ | ✓ | ✓ | ✓ | ||||||||
| Alpha Vantage | ✓ | ✓ | ✓ | ✓ | ✓ | ✓ | ✓ | 🔒 | ✓ | |||
| FMP | ✓ | ✓ | ✓ | ✓ | ✓ |
A tick means Fidolio has an implementation for it, not merely that the vendor sells it. Advertising a capability the app cannot deliver would hand you a picker that fails at the moment of use. 🔒 marks the one cell gated behind a paid plan, and it is a budget gate rather than an access one: those endpoints answer on a free key, at three requests per symbol, which against a 25-a-day allowance would cover eight symbols and starve everything sharing it.
One of them needs no sign-up
SEC EDGAR serves company filings — free, keyless, public domain, and with no daily cap. It leads the ordering for financial statements for exactly that reason: the Financials tab, the DCF inputs and the screener’s filing depth all work on an install that has never been given a credential.
Everything else here is a vendor that publishes what its API does and stands behind it. That is the deliberate limit: an undocumented endpoint scraped from somebody’s web front end can serve a great deal of data right up to the morning it changes without notice, and a portfolio tracker that silently stops pricing itself is worse than one that asked for a key.
Which key to get first
Any one of the four will price a portfolio, and the free tiers differ mostly in what else they unlock and how hard you can push them:
- Alpaca — prices, daily bars and dividends, free and uncapped for market data, and the only one that prices a whole portfolio in a single request. The best first key if you mainly want the position and performance screens right.
- Finnhub — 60 requests a minute with no daily cap. Buys the Fundamentals section, the analyst rating tally and fetched peer companies.
- Alpha Vantage — 25 requests a day for everything combined, which is why the app rations it. Buys the analyst target and the company-data figures nothing else here supplies.
- FMP — 250 a day. Buys financial statements and the analyst estimates table.
None of them is required to use Fidolio: importing, XIRR, dividends, income and the inflation comparison are all computed from your own statements. A key buys live prices and the research sections on top.
Two datasets are compiled in
The US CPI-U series behind the inflation view and the sector and industry benchmark tables behind every “is this ratio normal?” comparison are bundled into the app rather than fetched. Both are small public datasets that move once a year: bundled, they cost no API budget, work with no network, and cannot change under you between two refreshes of the same page.
S&P 500 membership is bundled for the same reason, which is why the screener can name a company and place it in a sector before a single request is made.
Settings says who is answering
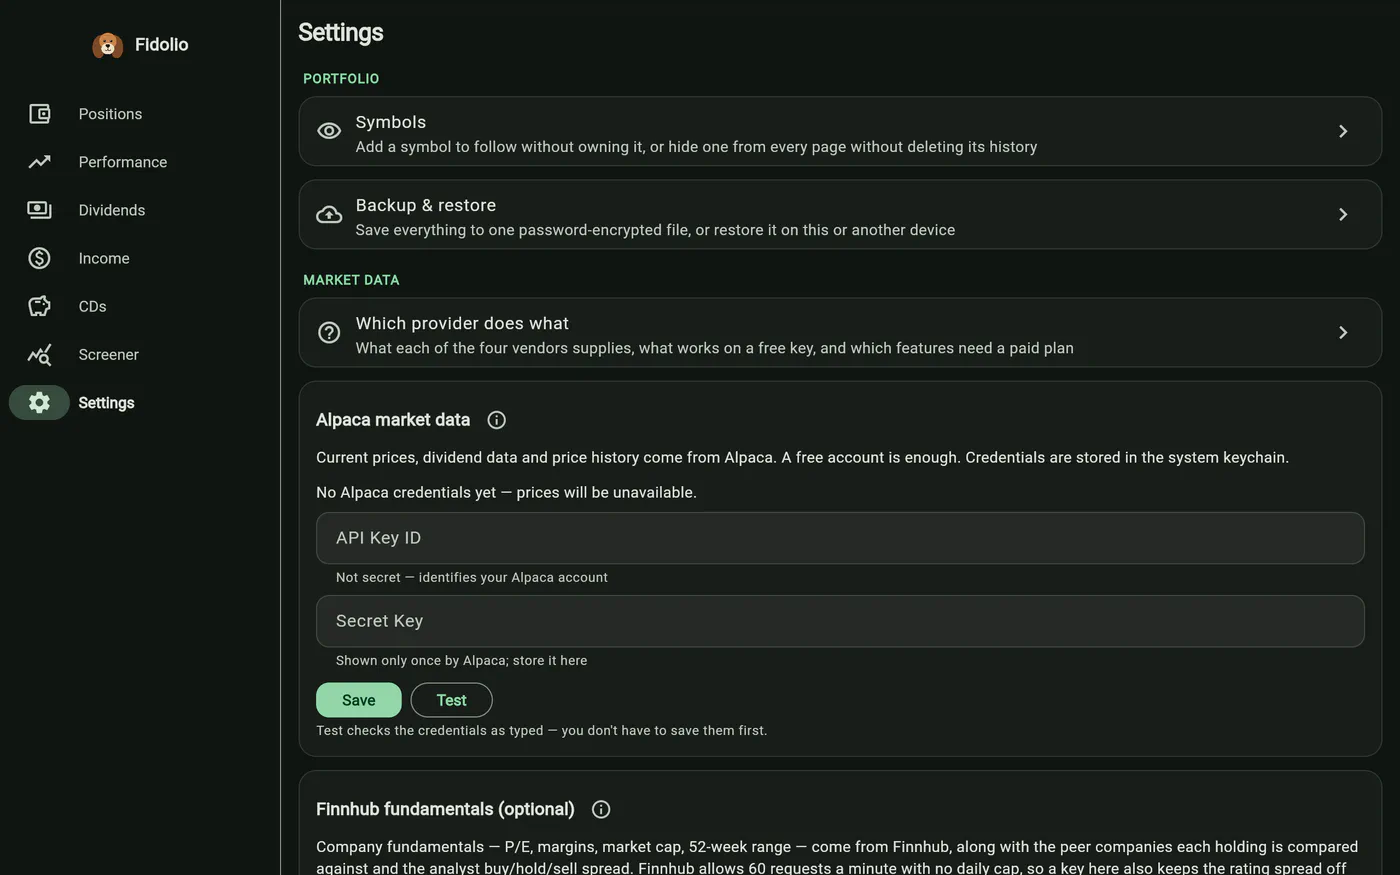
Every capability is listed with its current source. Where two or more vendors could serve it you get a dropdown whose default is Automatic; where only one can, the name is plain text, because a menu with a single entry is chrome; and where none can, it lists the vendors that would be able to — which makes that page the place you find out a feature exists at all.
Your holdings never leave the device
There is no account to create, no server to sync with and no telemetry. The database lives on your device, encrypted, and the only thing that ever goes over the network is a ticker symbol on its way to a quote API.
AES-256 at rest
Every storage box is opened with a 256-bit AES cipher, so the whole database is encrypted on disk. The key is random and generated on first run.
A master password you own
The key is wrapped with a key derived from your password — PBKDF2-HMAC-SHA256, 210,000 iterations, then AES-GCM. Changing the password re-wraps the key; it never re-encrypts your data, and never uploads it.
Biometrics, optionally
Face ID, Touch ID, Windows Hello and Android biometrics unlock the app where the platform offers them. The password stays mandatory everywhere — it is the recovery path.
Only symbols go out
A quote request carries a ticker. Share counts, balances, account names and cost bases are never sent anywhere, because nothing in the app has anywhere to send them.
Privacy mode
One toggle hides everything that reveals portfolio size — sensitive table columns, cards and totals disappear entirely rather than being blurred. Per-share prices, percentages and returns stay visible. Turning it back off requires re-authentication.
Delete all data, and mean it
One action empties every box, the id counters, the inflation overrides, the automatic backups, the account filter and the log buffer. Your API keys and app preferences are kept — those are configuration, not data — and the dialog spells out both lists.
The trade-off is stated rather than glossed: biometrics gate access to the app while the OS keychain protects the key at rest, and the key is not bound to a per-platform secure element. If you lose both the keychain entry and the master password, the data is unrecoverable and you re-import your statements — which is exactly why backups are automatic and on by default.
Get Fidolio
One app, five platforms, installed and updated by the store you already use.
Nothing is required to start: Fidolio opens on a sample portfolio, and your first CSV import replaces it. Live prices need one free API key from any of the four market-data vendors above — without one the app still imports, and still computes everything from your own statements.