
The reinvestment problem
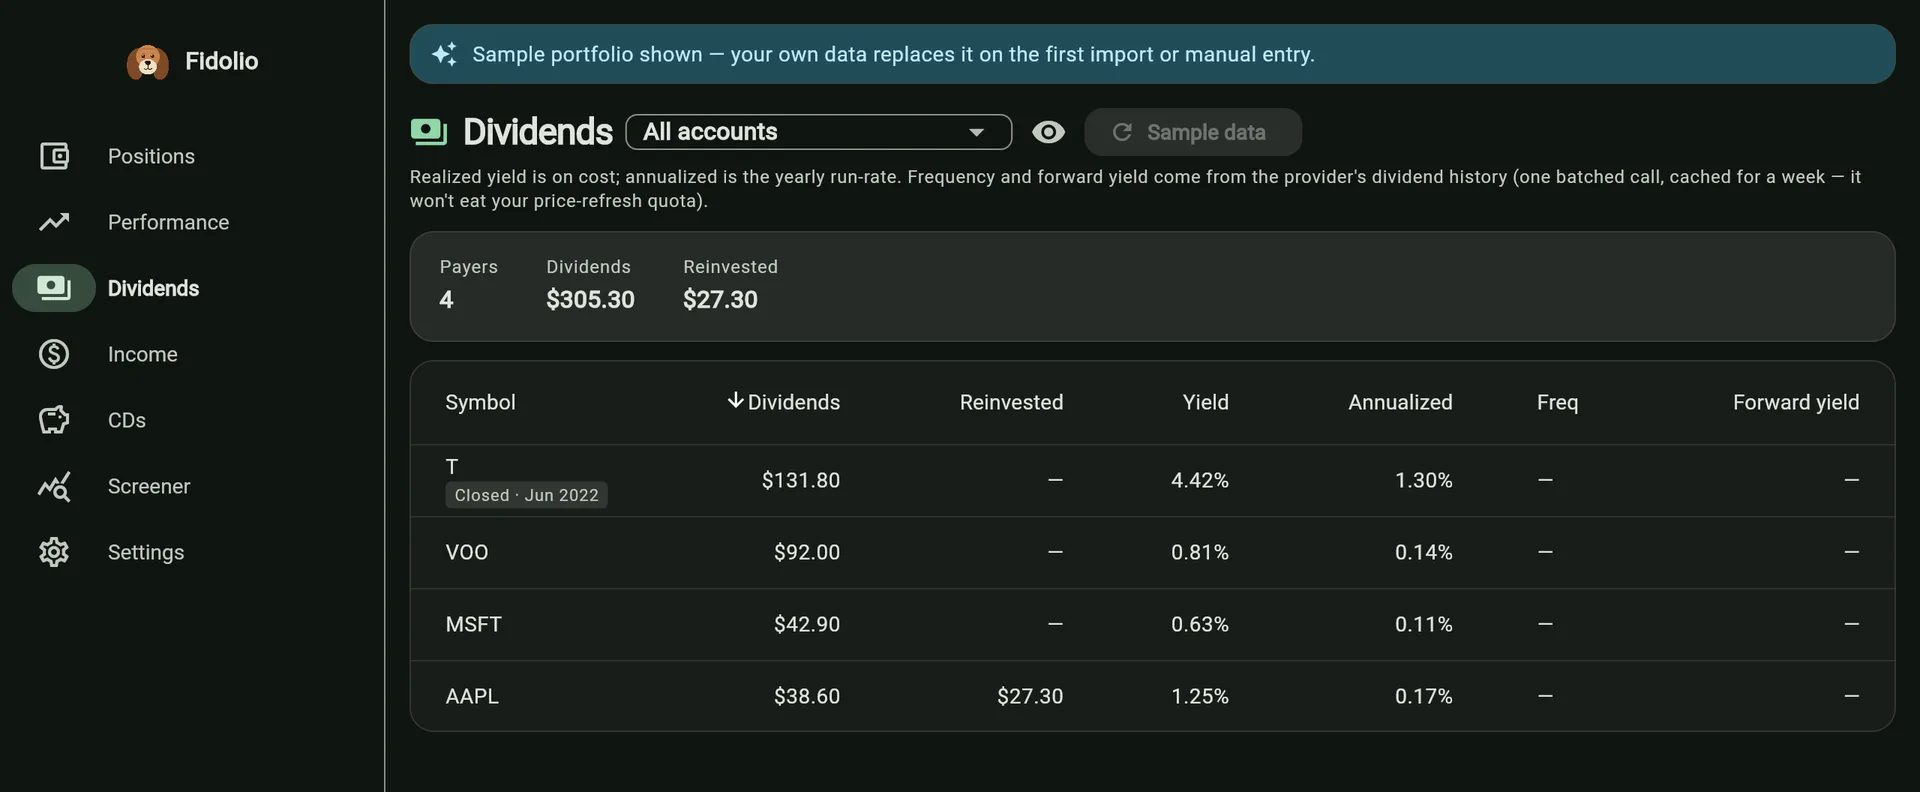
A reinvested dividend arrives from the broker as two rows: cash in, then cash straight back out buying shares. Count them naively and you either double the income or lose the shares.
Fidolio counts the dividend row as income and the reinvestment row as shares and cost, and includes both in XIRR — where they net to roughly zero on that date, which is the truth of what happened. The total is then split into the part that was reinvested and the part that arrived as cash, which is the split that matters if you are living on the income rather than compounding it.
Annualising honestly
The trap in every dividend metric is a short, incomplete holding. One payment, seventy days in, extrapolated to a year, produces a confident and meaningless percentage.
So the annualised yield picks its basis from what it actually knows:
| Position | Basis |
|---|---|
| Closed | Total received over the actual holding period — a matured three-month CD paying 1.2% reads as ~4.7%/yr |
| Open, held ≥ 1 year | Total over years held |
| Open, < 1 year, ≥ 2 payments | Cadence inferred from the observed interval between them |
| Open, < 1 year, 1 payment | Nothing. The app shows “—” |
That last row is the point. There is no honest annual rate to be had from a single payment, and inventing one would be the most confidently wrong number on the screen.
Forward yield, and the next payment
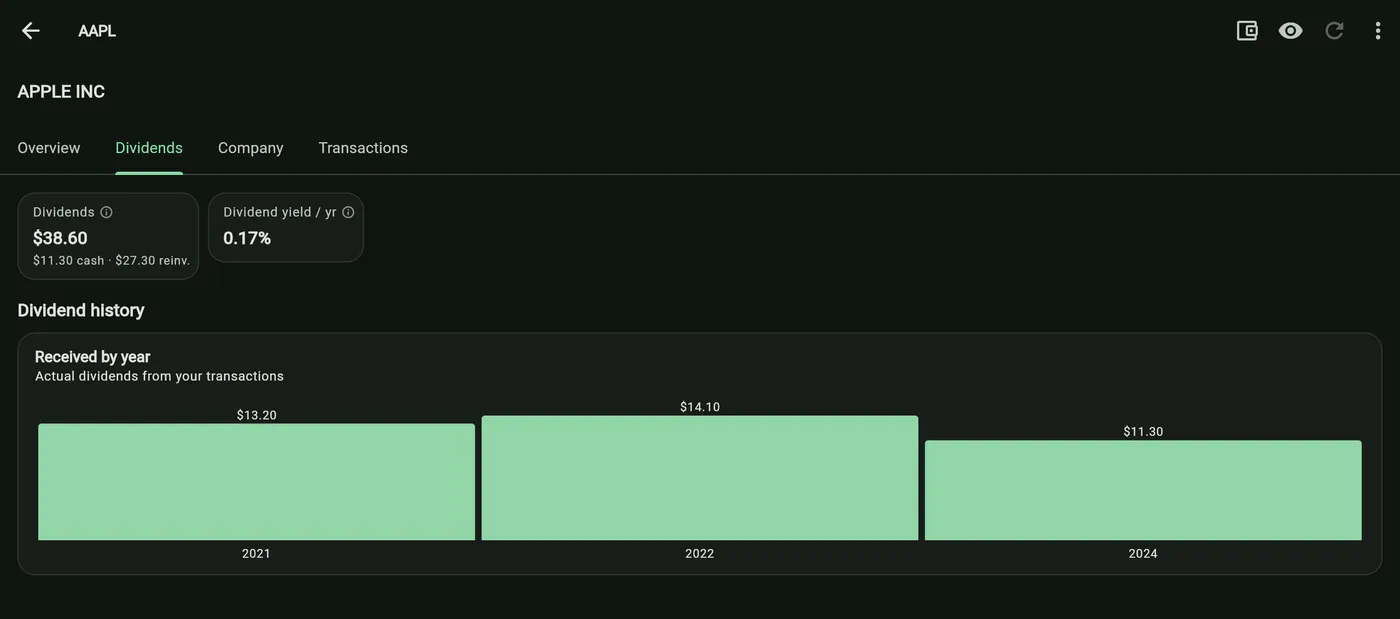
Where a dividend source is configured, Fidolio also stores the declared frequency, the last payment per share with its ex-date, and the indicated annual dividend — the latest regular payment times its frequency. That gives a forward yield on your average cost, which works for a position bought last month where a realised yield cannot.
The corporate-actions data reaches roughly a year ahead, so announced-but-unpaid dividends come back too. Those are a known milestone rather than an estimate, and they are labelled declared wherever they appear — on the stock page and in the income forecast.
Where a broker’s own frequency is wrong
Declared frequency is taken as a hint, not gospel: the cadence is inferred from the median gap between actual ex-dates, which survives a missing payment or an odd special distribution. Symbols that pay nothing are cached as paying nothing, so they are not re-asked twice a week.