
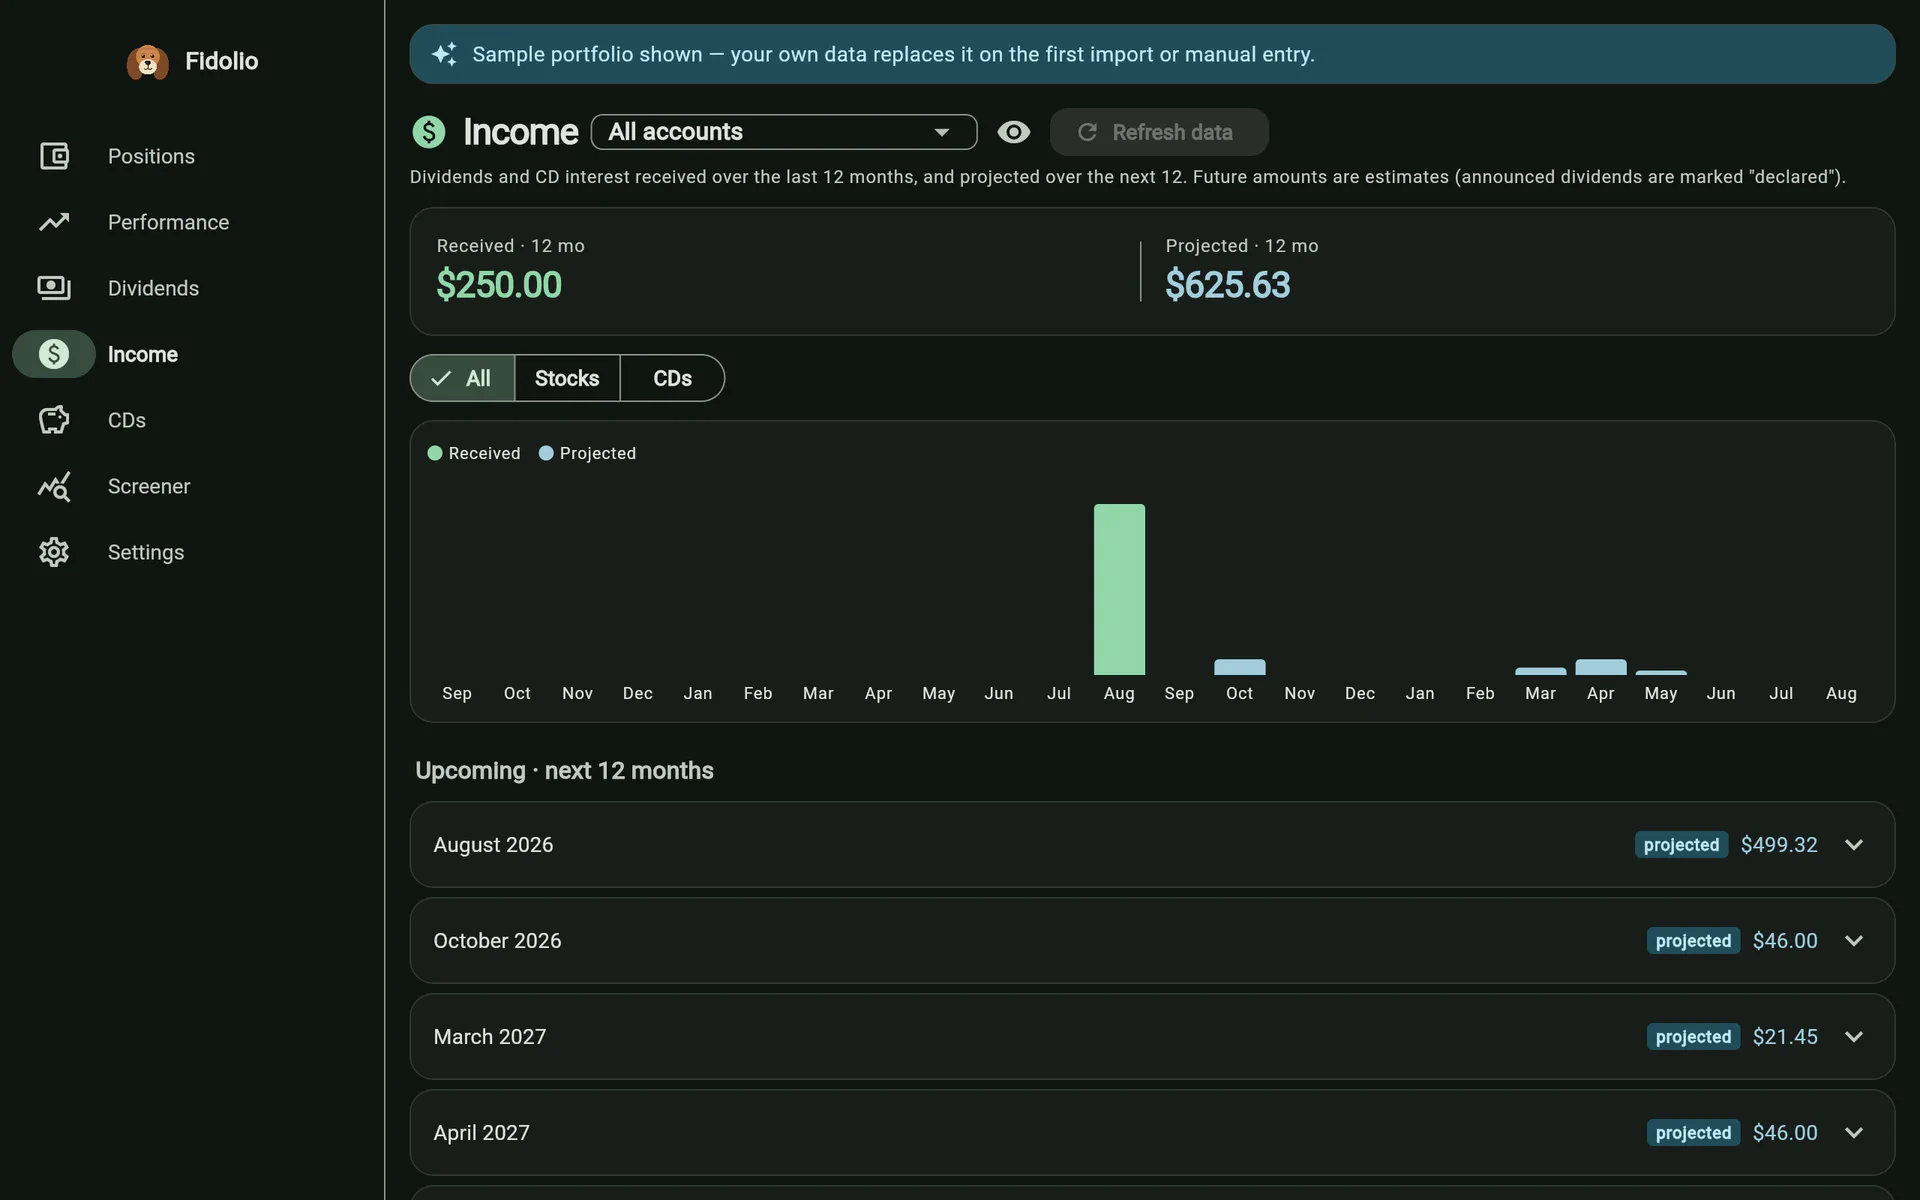
“How much did this portfolio pay me, and how much will it pay me next year” is one question, so it is one screen.
Received
Dividends and interest from your own transactions over the trailing twelve months. Capital-gain distributions classify as dividends and are included — they are money that arrived.
Projected
For each position you currently hold, the next twelve months are built in descending order of how much is actually known:
- The announced dividend, where the provider has one — a real declared amount on a real ex-date, flagged as declared rather than estimated. The rest of the year is then projected forward from it at the declared cadence.
- The last rate per share × your shares, at that cadence.
- The cadence inferred from the position’s own dividend history, when no provider data exists at all.
Each held certificate of deposit contributes a single event on its maturity date: the interest still to come — principal × coupon × term, less what has already been paid — and the principal itself returning. Both are parsed out of the description the broker wrote.
Reading it
The hero states the two twelve-month totals. A stocks / CDs / all filter sits above a bar chart spanning the whole 24 months, with received bars and projected bars in different colours, scrollable sideways on a narrow screen.
Underneath are two sections of expandable month cards — Upcoming and Received — so a month total opens into the individual payments that make it up.
Every dollar figure here respects privacy mode; the per-share rates and percentages do not, because they say nothing about how much you hold.