
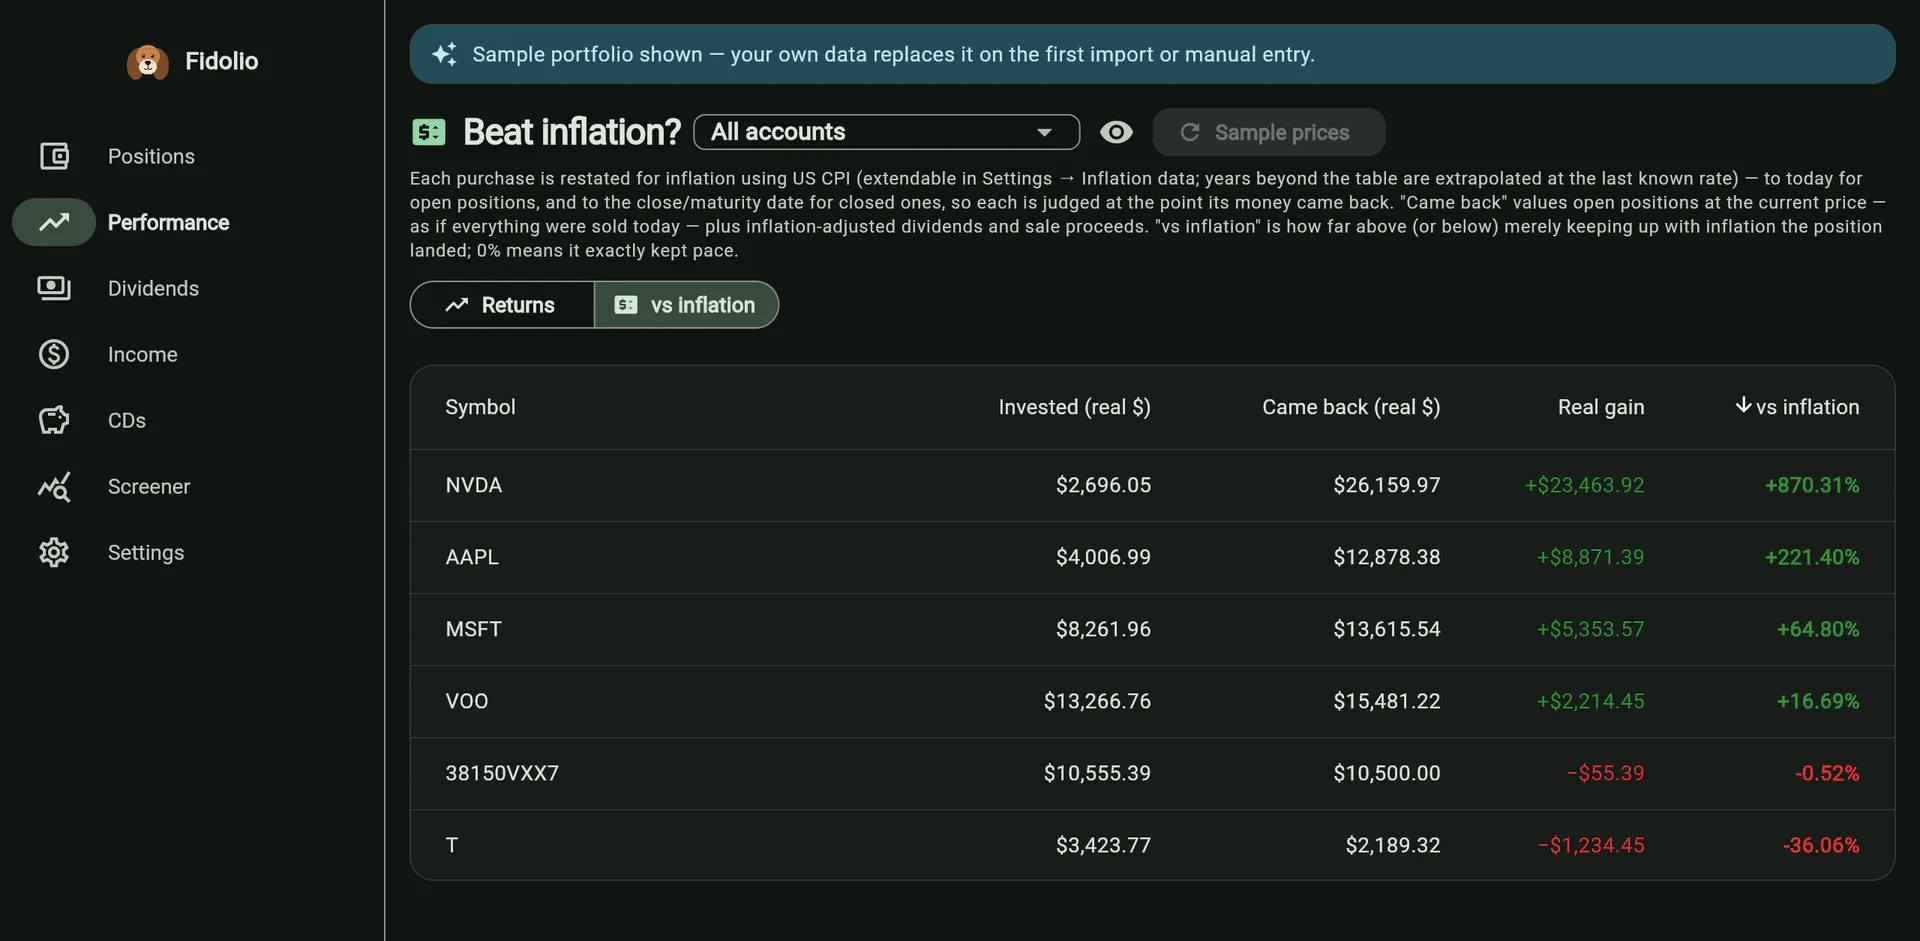
Beat inflation?
Every purchase restated in reference-date dollars against the US CPI-U, against what the position is worth now plus its inflation-adjusted dividends and sale proceeds. A factor of 1.00× means the money exactly kept pace; anything less means the position lost real ground while its nominal figure looked positive.
Nominal returns flatter everything. A 4% year in a 6% inflation environment is a loss of purchasing power reported as a gain, and it is the only kind of loss that does not look like one.
This view is a second reading of the same holdings the Performance table lists — a switch under the header, not a separate place — and it asks one question of each: after inflation, did the money that came back buy more than the money that went in?
How it is computed
Each purchase is restated into reference-date dollars using the CPI-U series. Against that goes what came back, also inflation-adjusted: the current value for an open position, valued as though it were sold today, plus adjusted dividends and sale proceeds. The factor is the ratio. 1.00× is exactly keeping pace.
The reference date is not always today
For an open position it is today. For a closed one it is the close or maturity date, and that distinction is load-bearing: a matured CD’s money came back on its maturity date, so inflating its cost all the way to the present would penalise it for inflation that happened after it had already paid out.
For a stock every cash flow is inflated, so the reference date cancels out of the factor and only the displayed dollar amounts move. For a CD it does not cancel, because the principal returns at face value — which is exactly why the choice of date has to be right.
CDs are computed differently, deliberately
A certificate of deposit gets no market price and no current value. Its invested amount is inflation-adjusted; its money back is the nominal principal plus nominal interest, because that is literally what the bank returns. Compared against the adjusted cost, this shows a CD losing real ground whenever its rate trailed inflation — and it can never be excluded from the table merely for lacking a price, which is what would happen if it were treated like a stock.
The CPI series
The US CPI-U annual averages from 1990 are compiled into the app, in the same spirit as the sector benchmark tables: a small public dataset that moves once a year, costs no API request, works with no network, and cannot change underneath you between two refreshes of the same page. Dates before the table clamp; dates past its end extrapolate at the last known year-over-year rate.
Settings → Inflation data takes your own annual rates for years after the last actual one, so the projection reflects what you think is happening rather than an extrapolation. Those overrides are portfolio data: they travel in backups, and “Delete all data” clears them.
Open stock positions with no cached price are excluded from the total row, with a footnote saying so — an unpriced position cannot be judged, and quietly counting it as zero would be worse than leaving it out.