
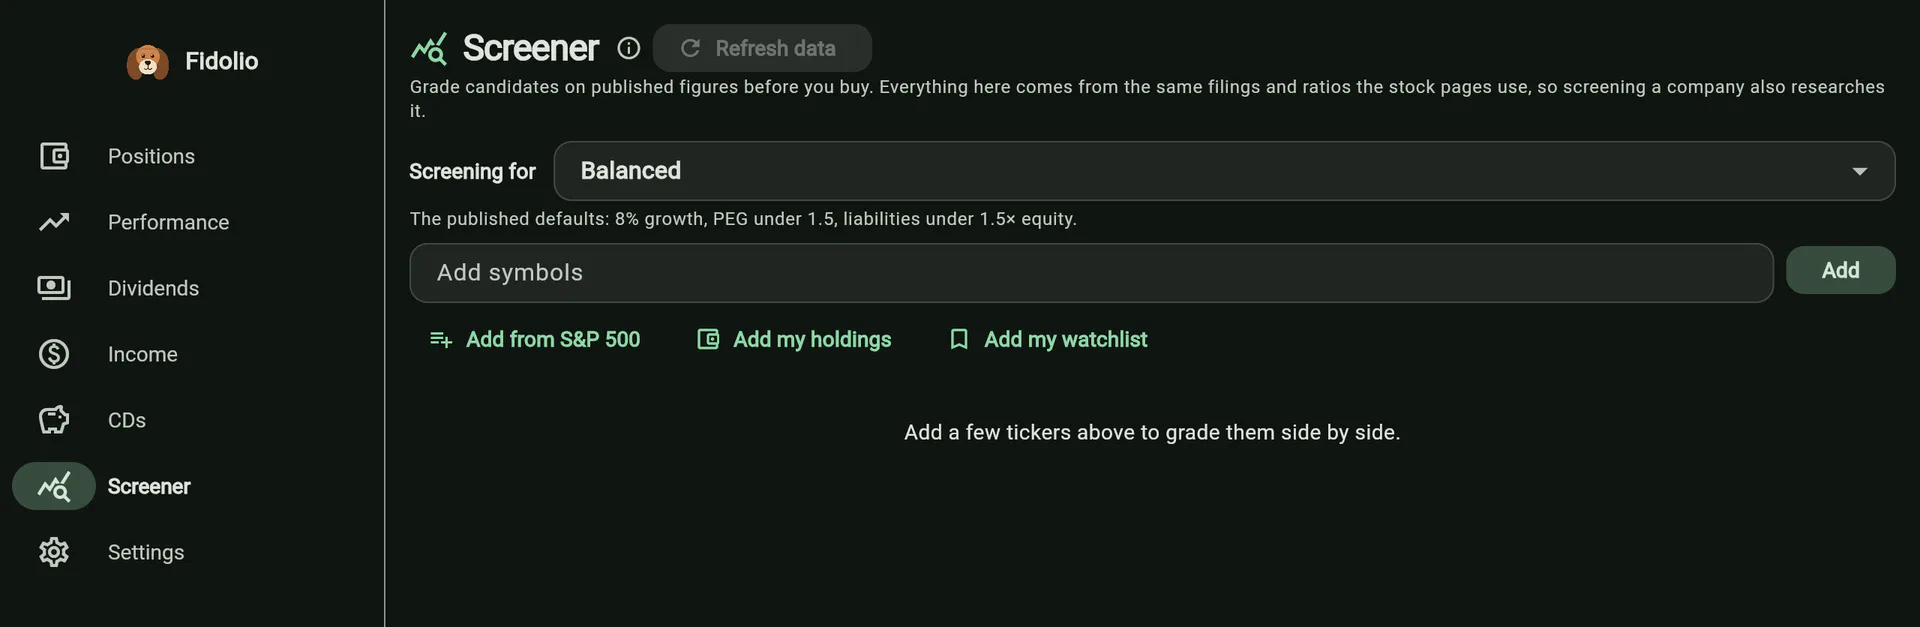
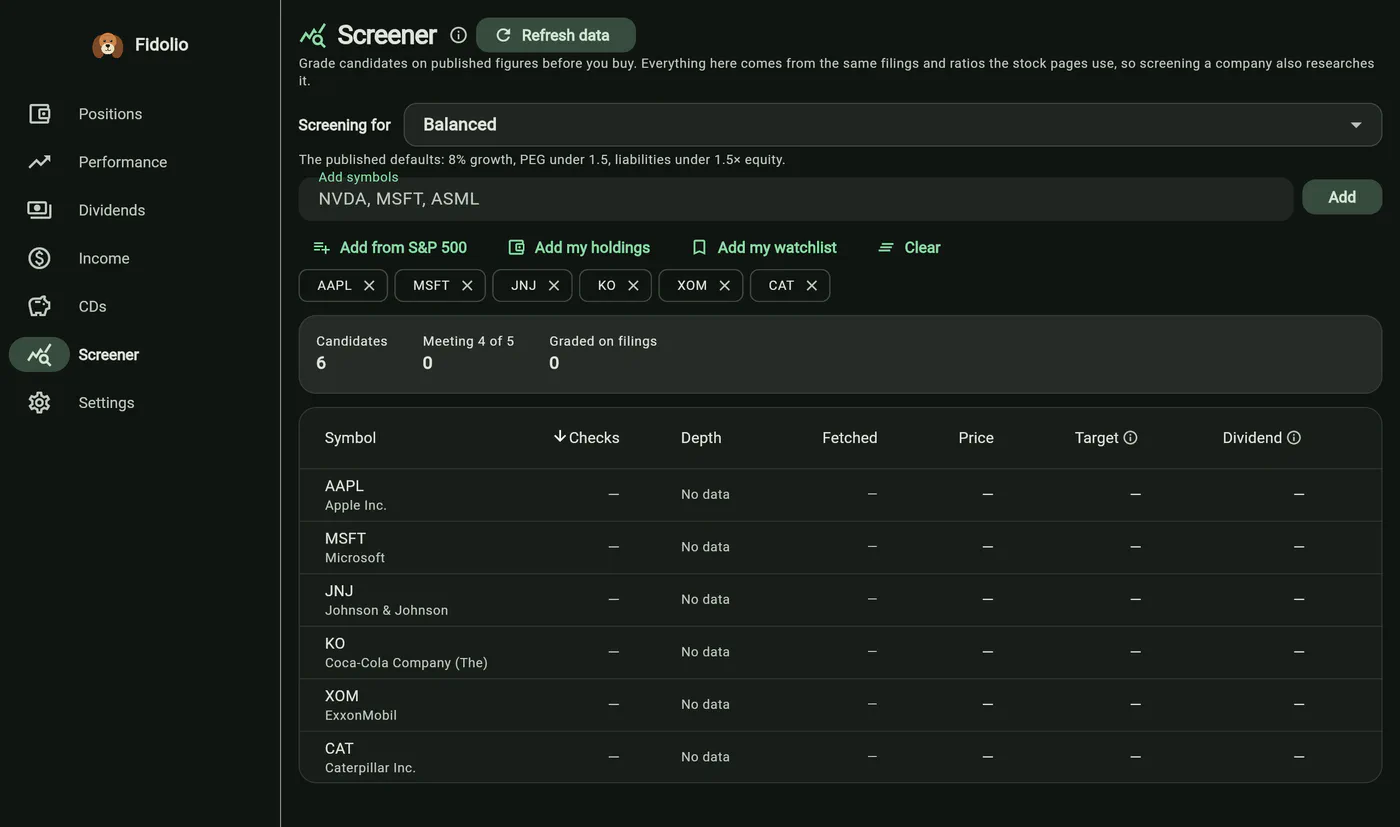
Screening a company in Fidolio also researches it: the grid reads the same caches every stock page reads, so a row’s tap opens the full symbol page already populated.
The checklist
Five criteria, each with a stated threshold, each reporting the figure it was judged on and by how much it cleared or missed. The goal profile swaps the thresholds — balanced, growth, income or value — and the page always states which profile produced the verdict.
Named profiles rather than sliders is a deliberate choice. Sliders invite tuning a screen until it returns the answer you already wanted, which is the exact failure this page exists to prevent. A profile is a stated intent.
Silence is not a failing grade
A criterion with no input abstains, and is excluded from the count rather
than marked failed. So the chip reads met / assessable — a company with no
filings reads “2/3”, not “2/5”, which would count two questions nobody asked as
two failures.
A negative latest net income is a different matter: that is a fail with the reason given, because a loss is a real answer.
The colour is what keeps the ratio honest. It tracks the absolute count, so four of four renders strongly and one of one renders muted — those are not the same claim, and no ratio can say so by itself. Sorting works the same way, so a 1/1 can never outrank a 4/5.
Depth, and what a refresh costs
Sources have wildly different allowances — one is 60 requests a minute, another 250 a day, another 25 a day for everything combined — so the refresh is tiered. Cheap ratios run over the whole universe; filings and company data run over a shortlist of the top candidates by the current sort.
Every row therefore states its depth and when its oldest input was fetched. A “3 of 5” standing on two ratios is a much weaker statement than one standing on five years of accounts, and showing them identically would be the misleading part. Before it spends anything, the page states what the refresh will cost in requests, download size and time.
Ranked against what you already own
The useful question is never “is this good” but “is it better than what I would sell to buy it”. So your own holdings are graded on the same checklist from caches already on disk and ranked in the same order — and a symbol that is both held and a candidate is excluded, so it cannot rank against itself.
Published scores, at no extra cost
From statements already fetched, each row also carries Piotroski’s F-Score (nine binary tests) and Altman’s Z″, each stated as its author published it and each reporting how many of its terms could actually be computed. Colours come from those authors’ own cutoffs, so the tint and the words in the detail sheet can never disagree.
The Beneish M-Score is deliberately absent: four of its eight indices need line items no statements provider here supplies, and inventing them would put a published model’s name on something that is not it. The accruals ratio — the part of that idea the data does support — is shown under its own name instead.