
Kubernetes and everything
around it, from your phone
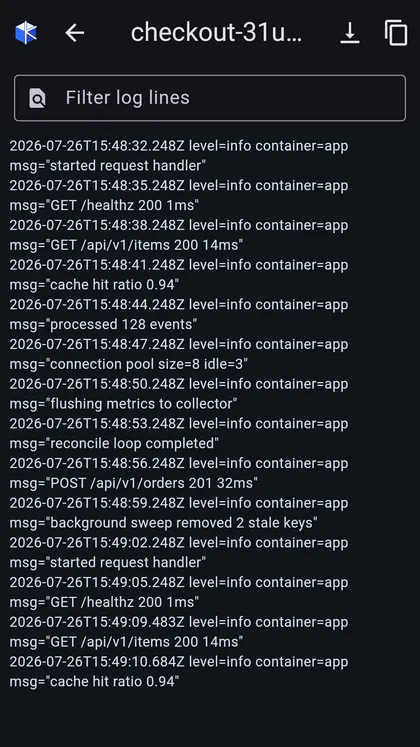
Kubo is a mobile-first console for your infrastructure. Watch pods live, stream logs, exec into a container, sync an ArgoCD app, purge a queue, run a PromQL query or browse a bucket — from the phone in your pocket, over the same private network your cluster already trusts.
Store listings are on their way. Links here will go live with the first public release.
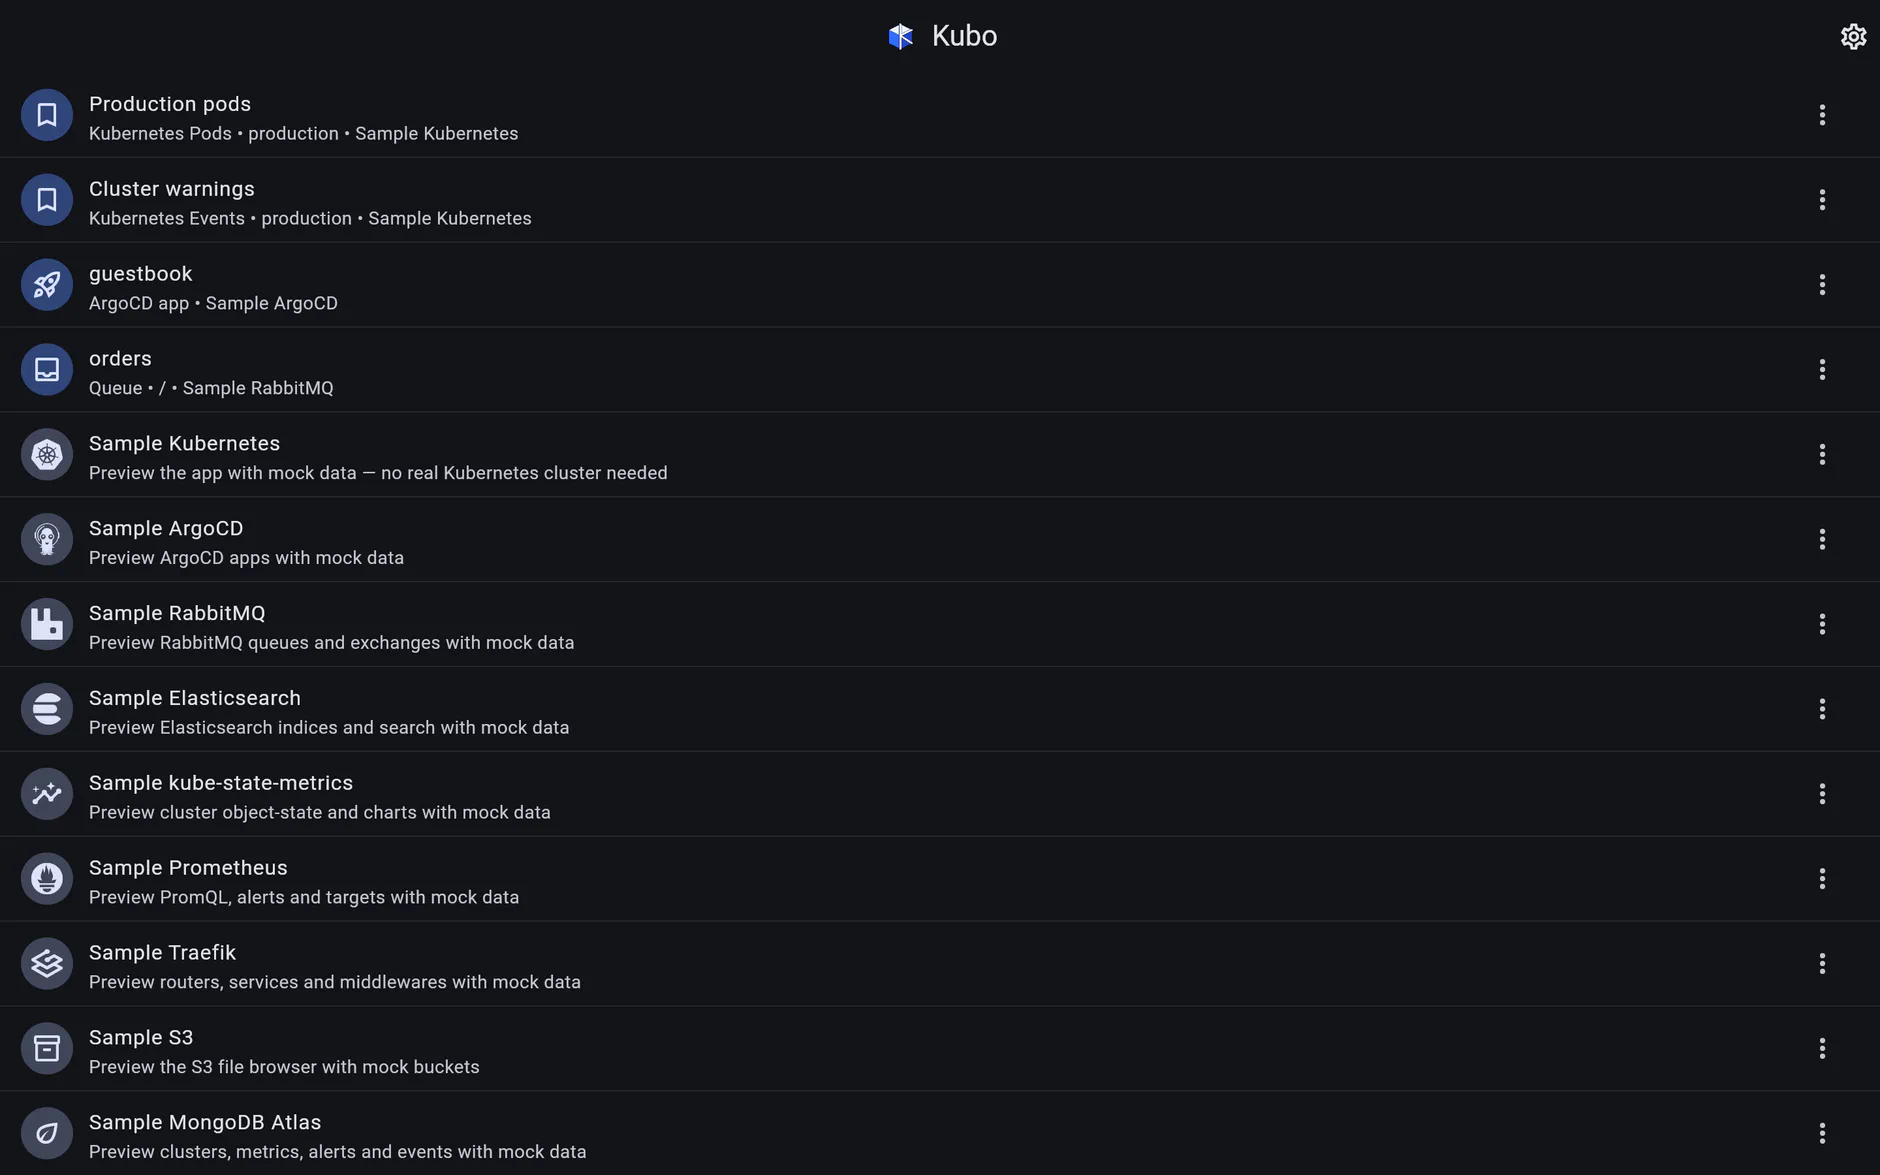
One app, every system you get paged about
An incident is never only Kubernetes. Kubo treats each platform as a first-class connection — added once, opened from the same list — so the pod, the deploy that shipped it, the queue it drains and the logs it wrote are all a tap apart.
Kubernetes
Pods, workloads, jobs, cronjobs, services and events — live over the watch API, with the actions you actually need on call.
Learn more →ArgoCD
Sync, refresh, restart and roll back applications — with the app's resource tree, events and pod logs on the detail page.
Learn more →kube-state-metrics
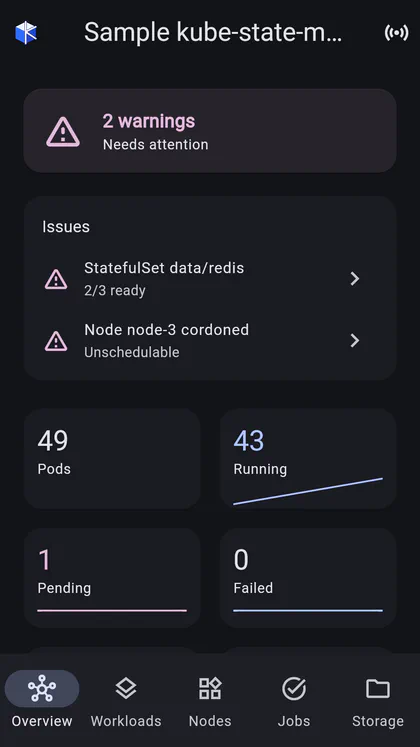
A cluster health dashboard: a red/amber/green hero, a ranked list of what is actually wrong, and gauges for requested-vs-allocatable capacity.
Learn more →Prometheus
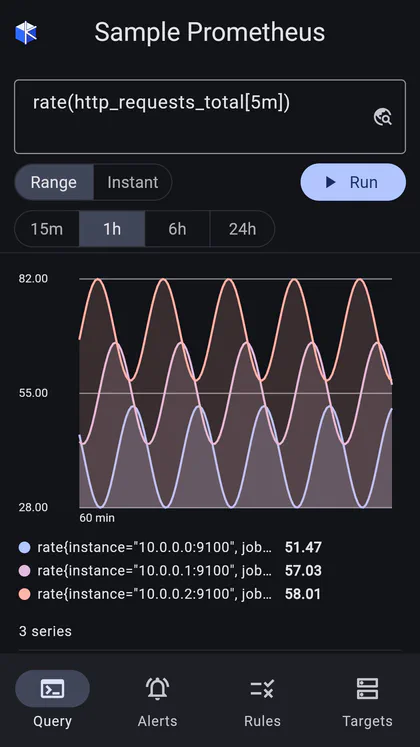
A PromQL explorer with a metric and label browser, plus alerts, rules and scrape targets.
Learn more →OpenObserve
Logs, metrics and traces from one connection — SQL log search with a live tail, PromQL metrics, and trace waterfalls.
Learn more →Elasticsearch
Lucene search over an index with a field explorer, three result layouts, a time-range filter and a live tail.
Learn more →RabbitMQ
Queues, exchanges, connections and nodes over the Management API — with history charts and safe actions like purge and force-close.
Learn more →Traefik
Routers, services, middlewares and entry points — plus live traffic rates, error percentages and latency derived from Traefik's metrics endpoint.
Learn more →S3 & object storage
A read-only file browser for AWS S3 and any S3-compatible store: folders, previews, recursive search, downloads and presigned share links.
Learn more →MongoDB Atlas
Project health, real historical metrics per process, the Performance Advisor's index suggestions and slow queries, alerts and events.
Learn more →MongoDB
A direct wire-protocol connection: per-collection ops and latency, real index usage, and a change-stream-driven activity heat map.
Learn more →kubectl console
Build a kubectl command by tapping suggestion cards, then run it — translated into plain API calls, printed the way kubectl would.
Learn more →Connections, bookmarks & history
One reorderable list of everything you connect to and every view you saved — grouped, renamed and colour-coded the way you work.
Learn more →Access, auth & credentials
Reach private clusters over Tailscale, sign in to EKS with IAM and no exec plugin, and reuse one secret across connections from a central credentials manager.
Learn more →Built for the moments you are away from a laptop
Every screen is designed for a phone first and scales up to a tablet or a desktop window. Nothing here is a wrapped web console — it is a native client talking directly to each system’s own API.
Your cluster, live
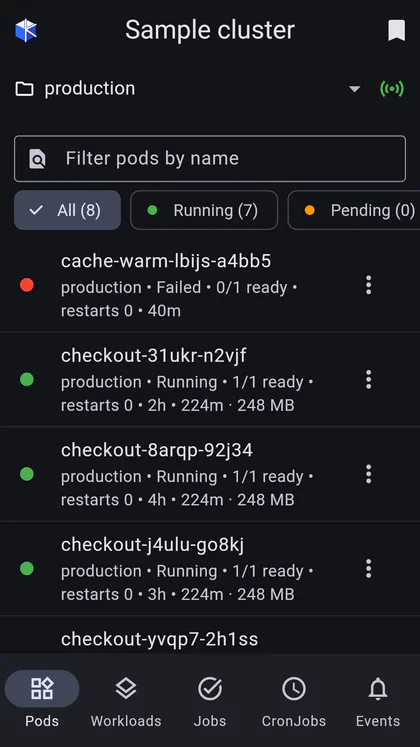
Six resource tabs — Pods, Workloads, Jobs, CronJobs, Services and Events — each namespace-scoped and updated over the Kubernetes watch API, not a refresh timer. Scale a Deployment, restart a rollout, suspend a Job, trigger a CronJob, delete a stuck pod, open a shell.
Learn more →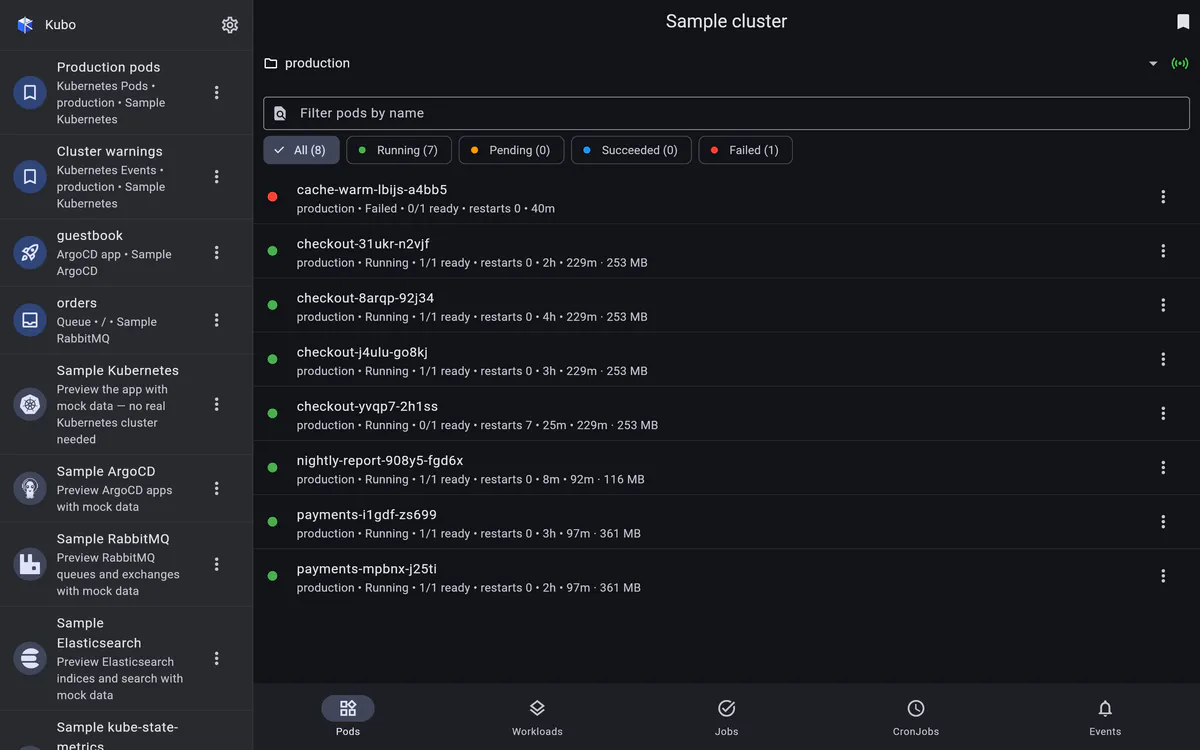
Sync — or roll back — from your phone
Kubo talks to the ArgoCD REST API, not the CRDs, so one connection covers every destination cluster an ArgoCD instance manages. Refresh, sync, restart workloads, or pick a revision from the history and roll back.
Learn more →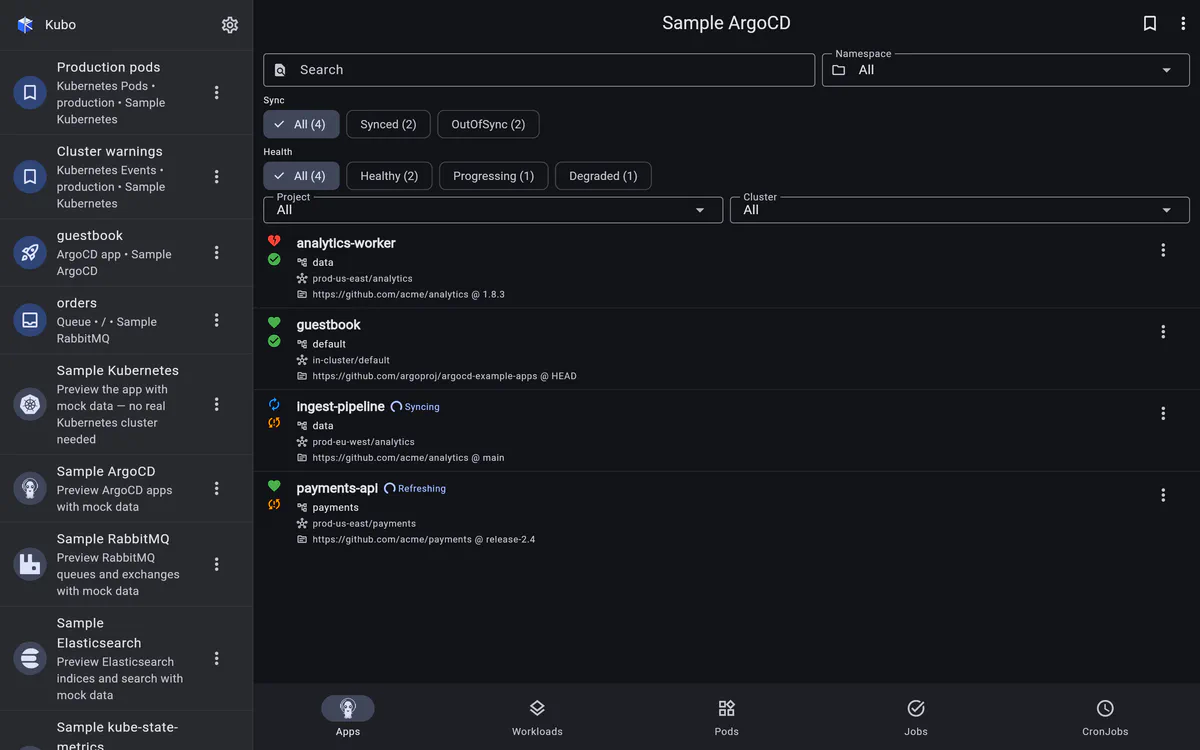
Is the cluster OK? One screen answers
kube-state-metrics turns Kubernetes object state into metrics; Kubo turns those metrics into an answer. A health hero, then a ranked, tappable list of issues — crash-looping containers, failed pods, under-replicated workloads, cordoned nodes, failed jobs, namespaces over quota.
Learn more →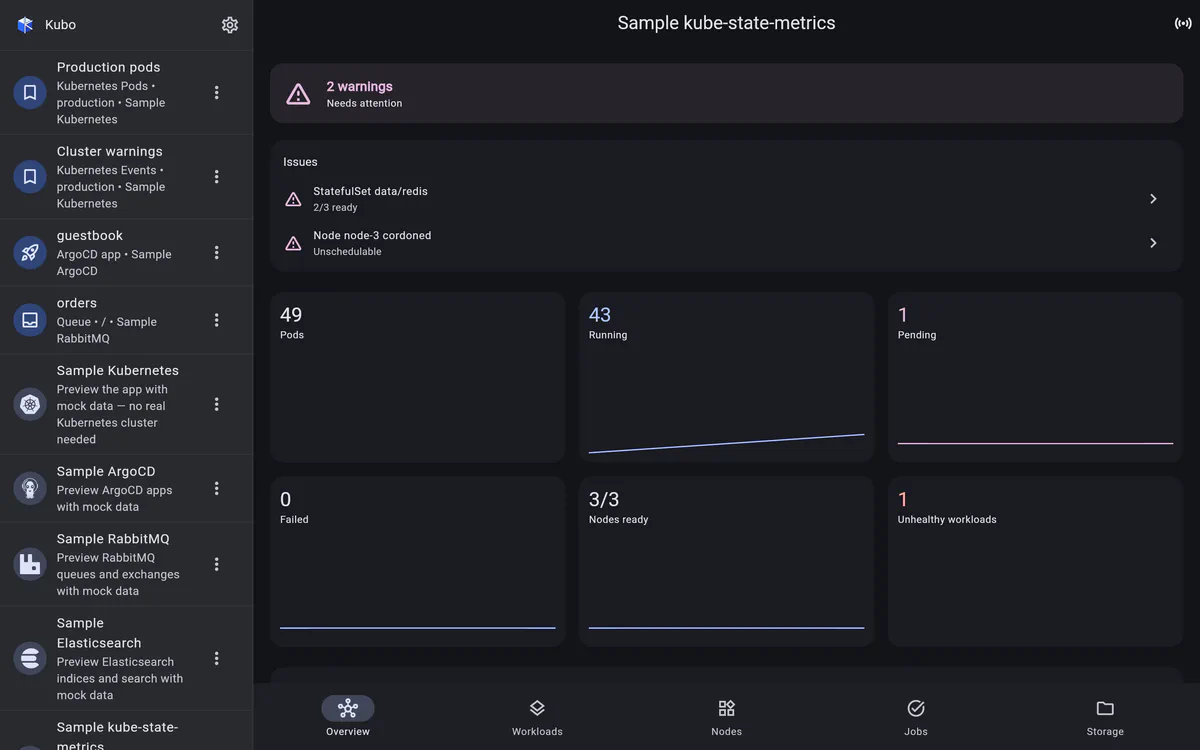
All three signals, one connection
OpenObserve is deployed as one instance holding the whole telemetry of a system, so Kubo treats it that way: Logs · Metrics · Traces · Streams behind a single connection. Search logs in SQL, query metrics in PromQL, and open a trace as a waterfall.
Learn more →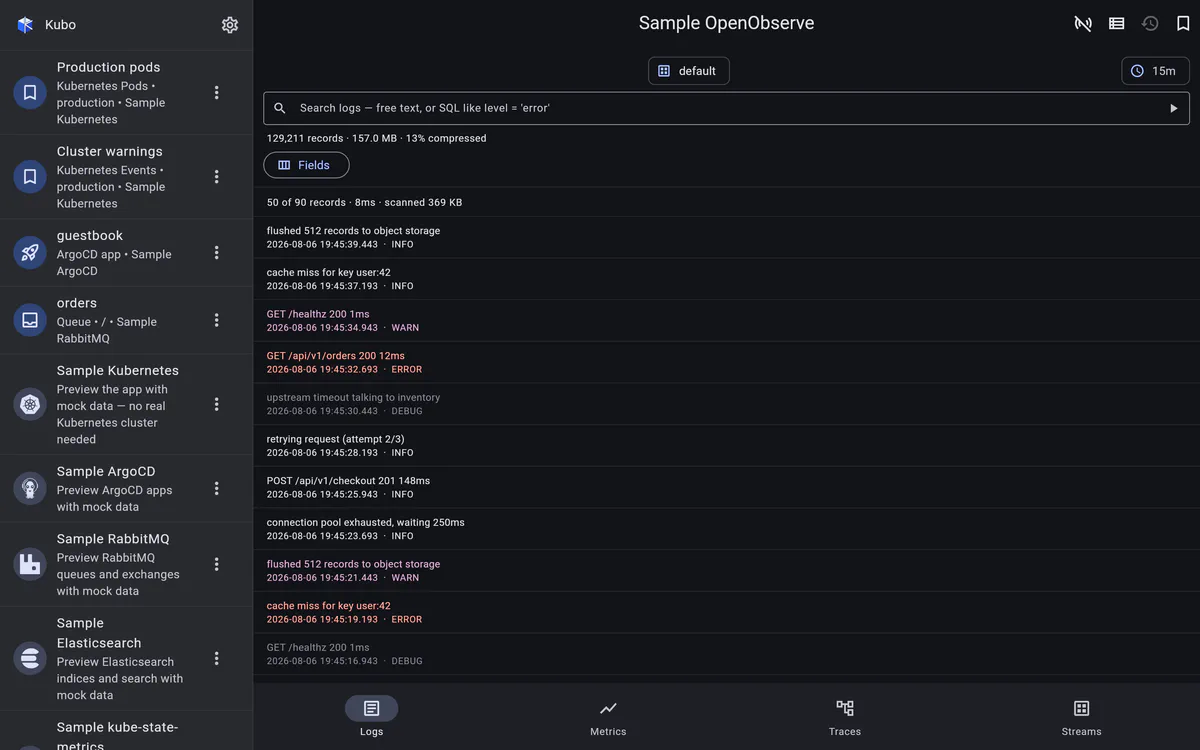
Is the queue draining?
Overview, Queues, Exchanges and Connections over the RabbitMQ Management HTTP API, with real history charts — and the small set of actions worth having on a phone: purge a queue, delete a queue or exchange, force-close a connection, each behind a confirm dialog.
Learn more →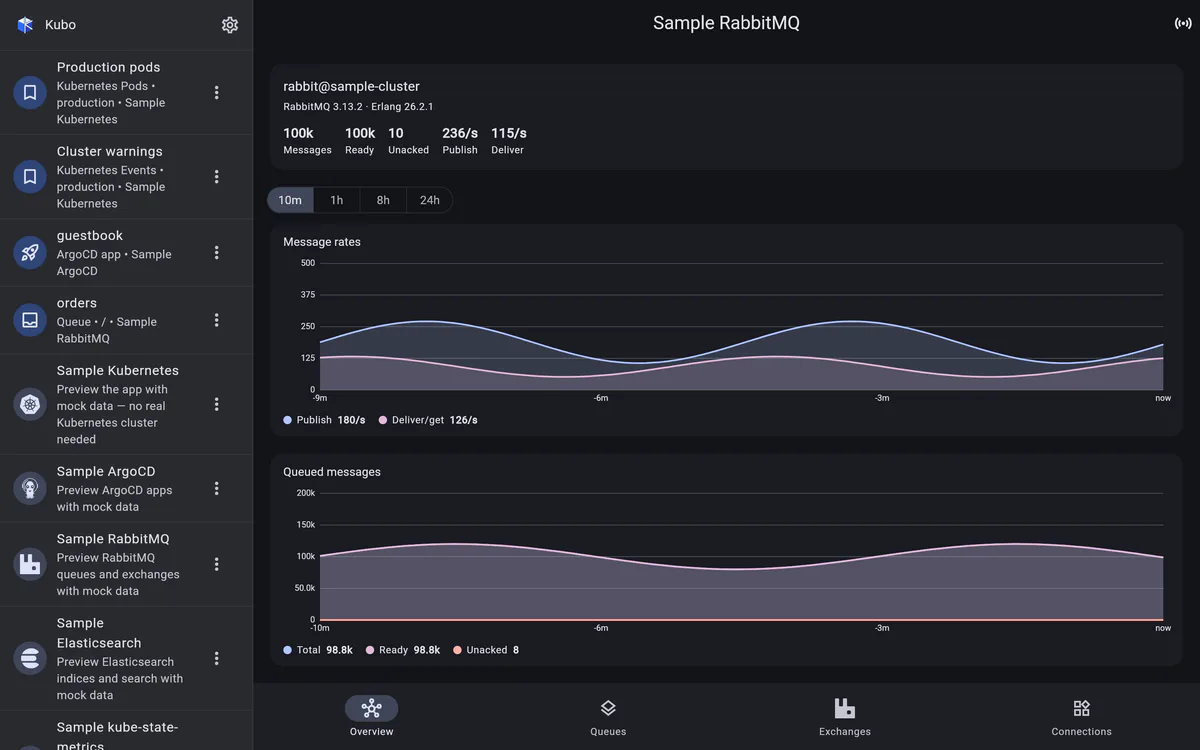
Watch a database work
A direct driver connection reads what an admin API cannot: per-collection ops and latency, real per-index usage, and a live change stream. The result is a heat map of collections × operations where colour tracks recent activity — fresh writes glow, quiet ones fade.
Learn more →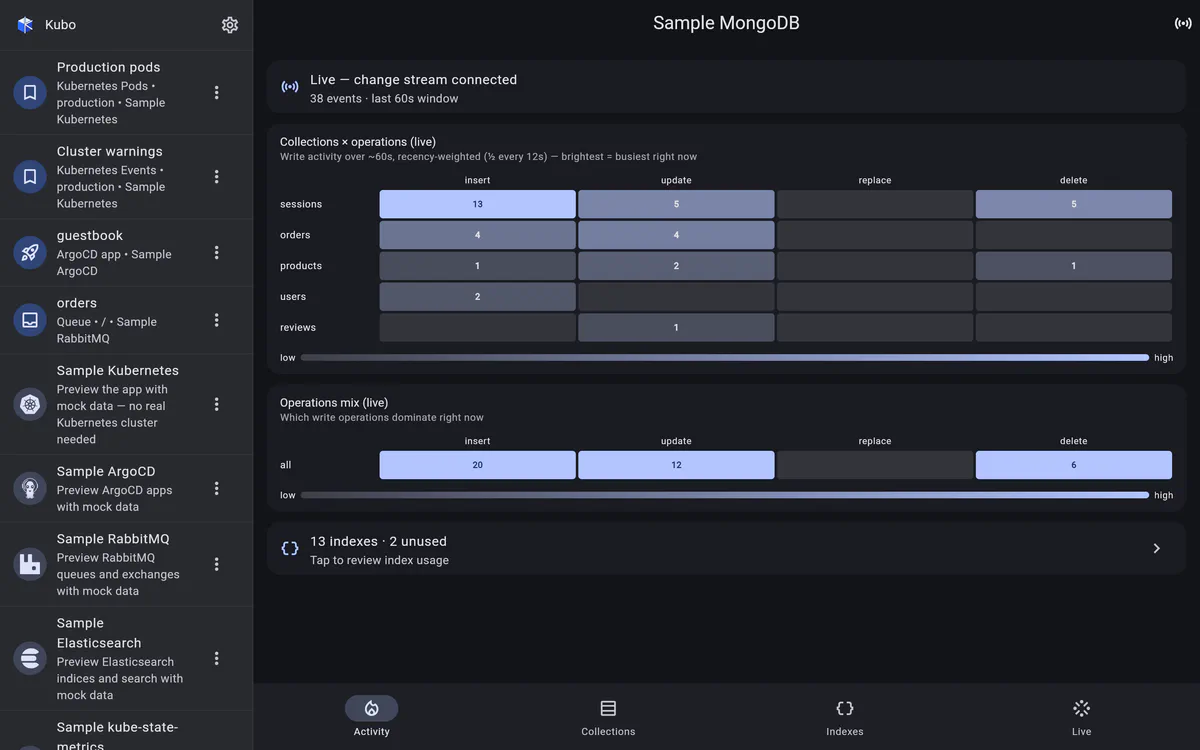
kubectl, without the keyboard
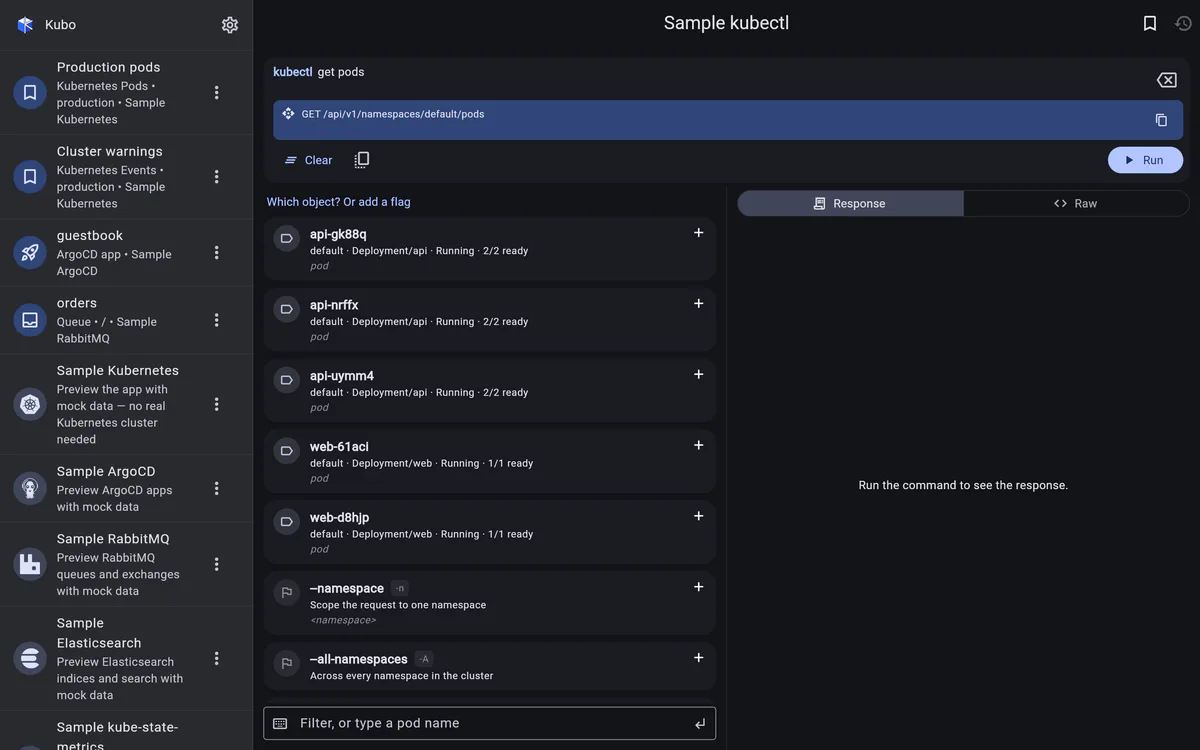
Typing kubectl get pods -n kube-system --field-selector… on a phone is miserable. So Kubo offers the next word of the command as a card — verb, resource type, name, flag — and tapping one appends it. There is no shell and no binary: the finished command is translated into REST calls and the response is printed the way kubectl prints it.
Two taps from buzz to broken pod
Bookmarks and connections share one list. A bookmark can be a single resource (a pod, an ArgoCD app, a queue) or a whole filtered view — ArgoCD CronJobs · staging · “api”. Long-press to reorder, group rows into collapsible sections, rename and colour anything.
Learn more →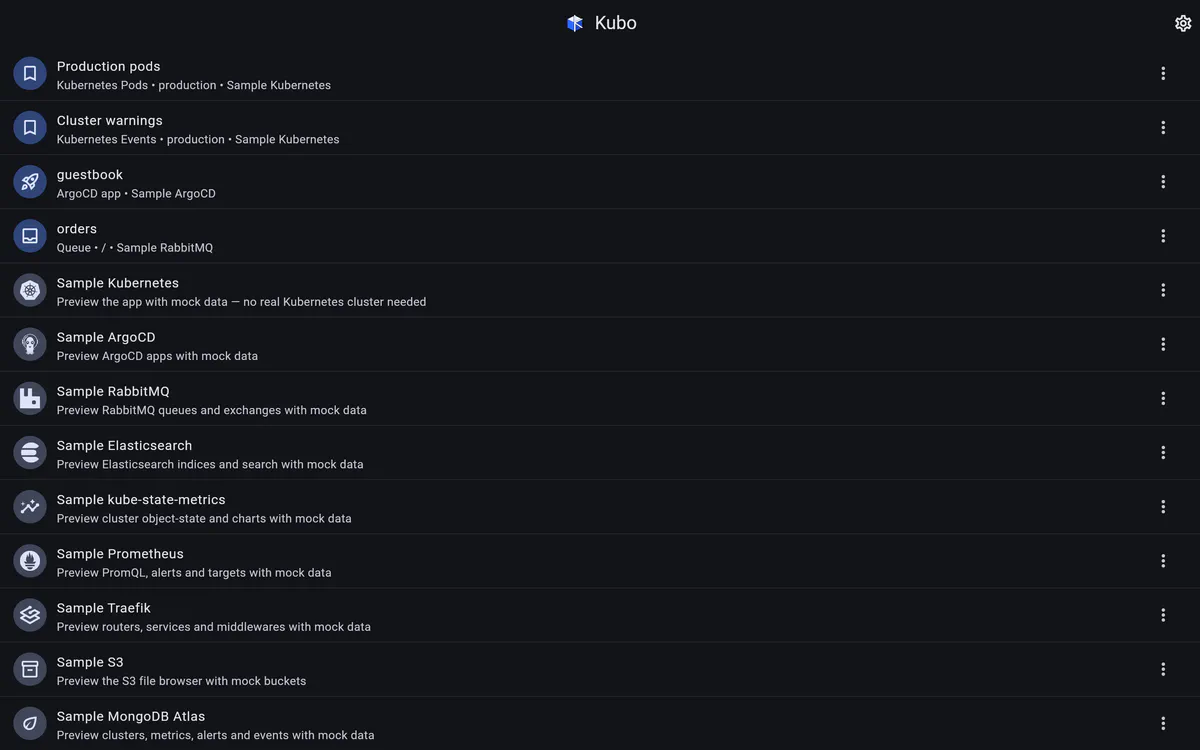
Phone-first, not phone-tolerant
Facet chips instead of flags, one-tap copy instead of selection handles, live lists instead of pull-to-refresh loops. The same app runs on a 6" phone, a tablet, and a desktop window with the connections panel pinned.
Get Kubo
One app for your phone, your tablet and your desktop — with the same connections list on all of them.
Store listings are on their way. Links here will go live with the first public release.
Not ready to point it at production? Kubo ships sample connections — a mock Kubernetes cluster, ArgoCD instance, RabbitMQ broker, Prometheus server, S3 endpoint and more. Switch one on under Settings → Sample connections and the whole app fills with realistic data: live lists, streaming logs, charts, even a working pod terminal and a change-stream heat map. No cluster, no broker, no credentials.