
kube-state-metrics
A cluster health dashboard: a red/amber/green hero, a ranked list of what is actually wrong, and gauges for requested-vs-allocatable capacity.
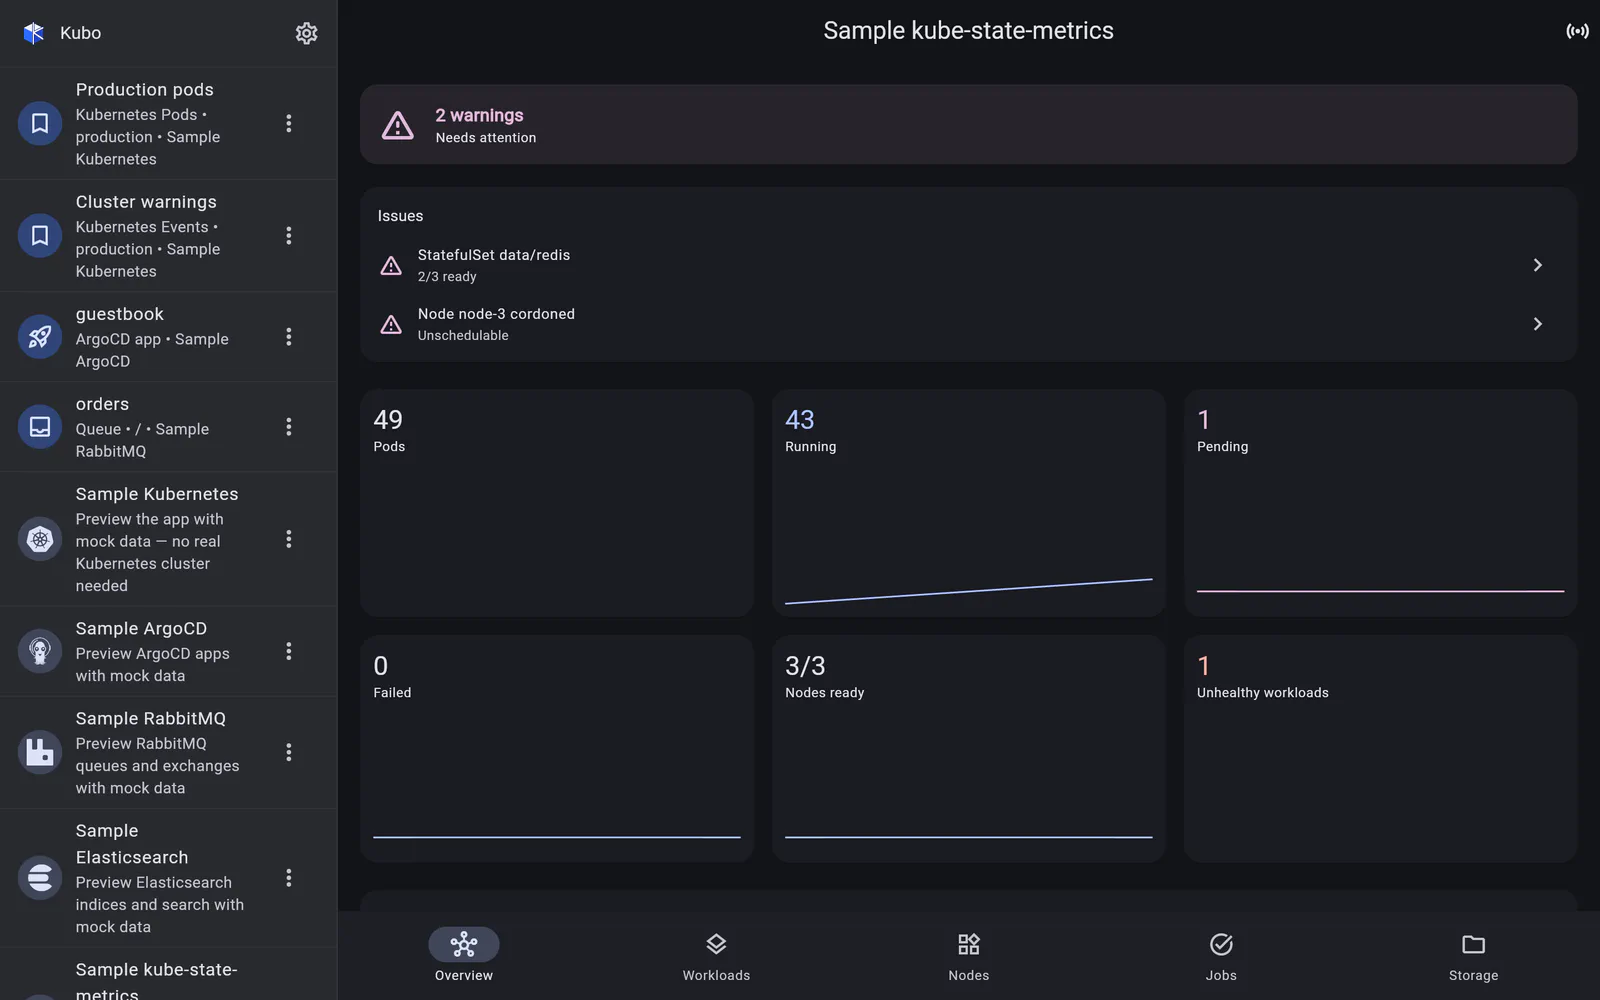
kube-state-metrics (KSM) exposes the state of Kubernetes objects as Prometheus metrics — how many replicas a Deployment wants versus has, whether a node is cordoned, how many times a container has restarted. It is the difference between “the API server is up” and “the cluster is healthy”.
Kubo scrapes that endpoint and aggregates it into a five-section dashboard: Overview · Workloads · Nodes · Jobs · Storage, with a namespace filter and search on the list sections, worst-first sorting throughout.
KSM speaks the Prometheus text exposition format and keeps no history — each scrape
is a current-state snapshot — so Kubo owns a parser for that format and polls, folding
cluster-level scalars into a session history store that backs the overview charts. If you
want real history rather than a session’s worth, query the same kube_* series through the
Prometheus connection; the two modules stay deliberately uncoupled.
In detail
The overview
A health hero, a ranked issues list where every row jumps to the thing that is wrong, and cluster capacity gauges.
Read →Workloads, Nodes, Jobs & Storage
The four list sections behind the overview, each filtered by namespace, searchable and sorted worst-first.
Read →Two ways to reach it
A direct /metrics URL, or a scrape through an existing cluster's API-server proxy — plus how polling and in-app history work.
Read →