
Workloads, Nodes, Jobs & Storage
The four list sections behind the overview, each filtered by namespace, searchable and sorted worst-first.
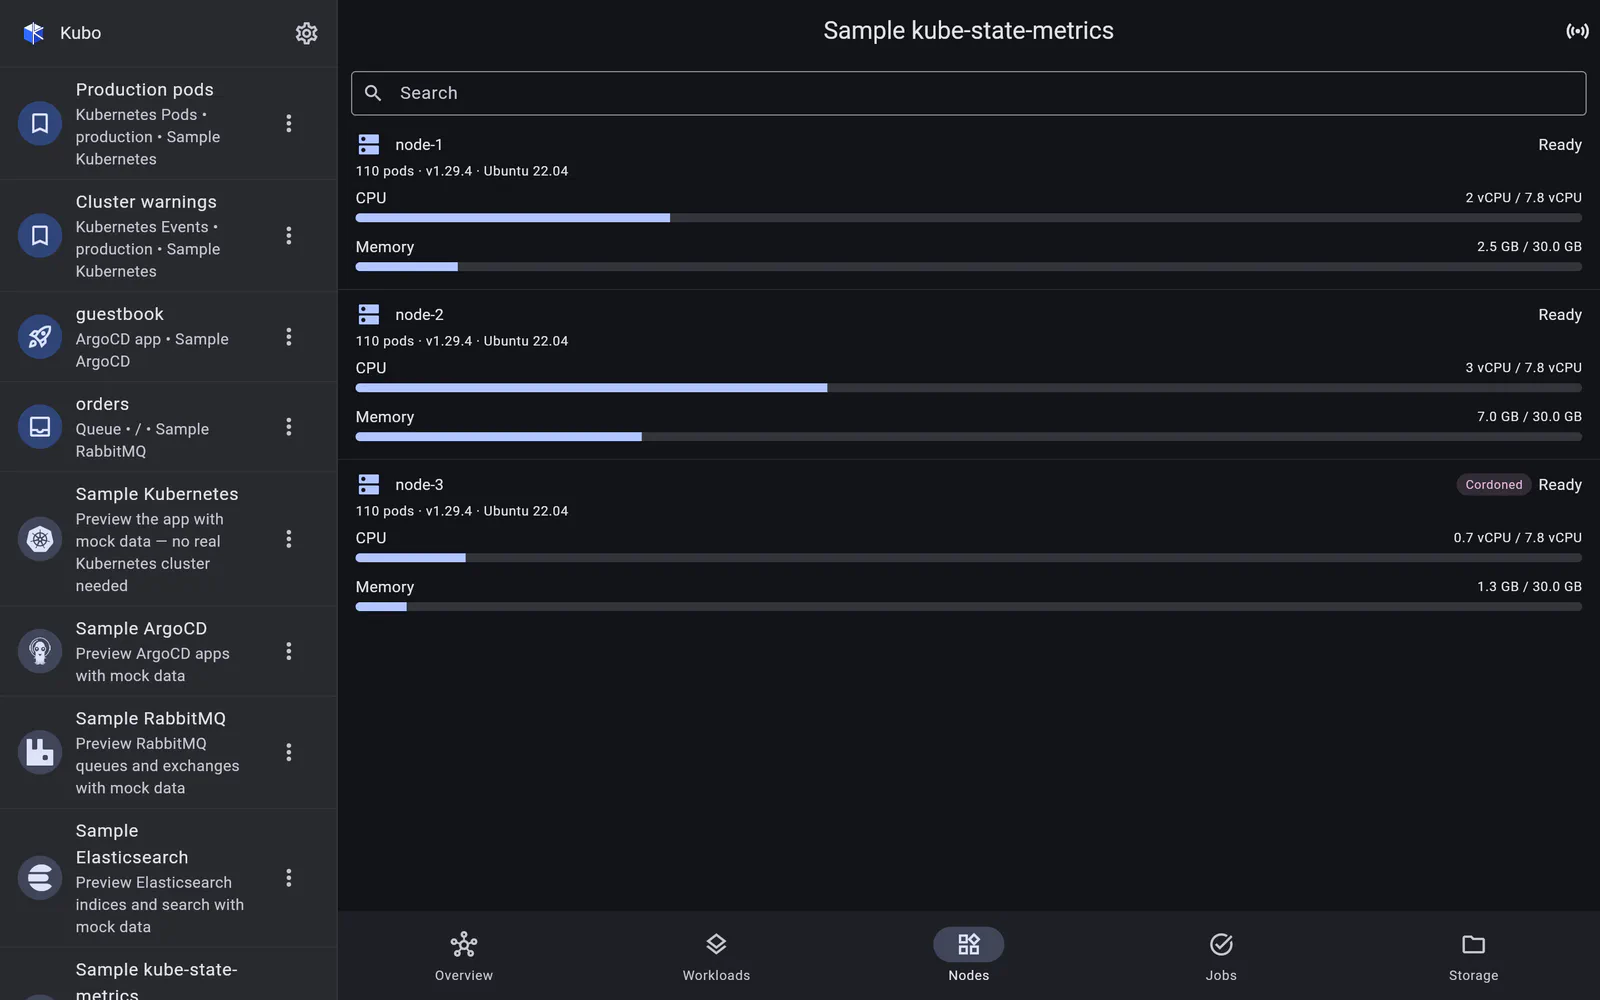
Every issue on the overview lands in one of these four sections, and each works standalone too. Workloads, Nodes and Storage carry a namespace filter and a search; everything sorts worst-first, so the top of the list is the part worth reading.
Workloads
Deployments, StatefulSets, DaemonSets and ReplicaSets with desired, ready and available replica counts, and the gap between them called out. An under-replicated workload appears here whether the cause is scheduling, image pulls or crash loops — the pod detail lives in the Kubernetes connection, which is one connection switch away.
Nodes
Per-node readiness, cordon and pressure conditions, plus allocation gauges for CPU and memory — requested against allocatable, per node. That per-node view is what tells you a cluster with plenty of headroom in aggregate has one node that cannot fit anything.
Jobs
Job completion and failure state, which on a cluster running scheduled work is the section most likely to hold an actual problem: a failed nightly job is invisible in a pod list an hour later, but KSM still reports it.
Storage
PersistentVolumeClaims and their phase and capacity, filtered by namespace — the “why is the pod Pending” answer that is not about CPU.
Back to kube-state-metrics.