
MongoDB Atlas
Project health, real historical metrics per process, the Performance Advisor’s index suggestions and slow queries, alerts and events.
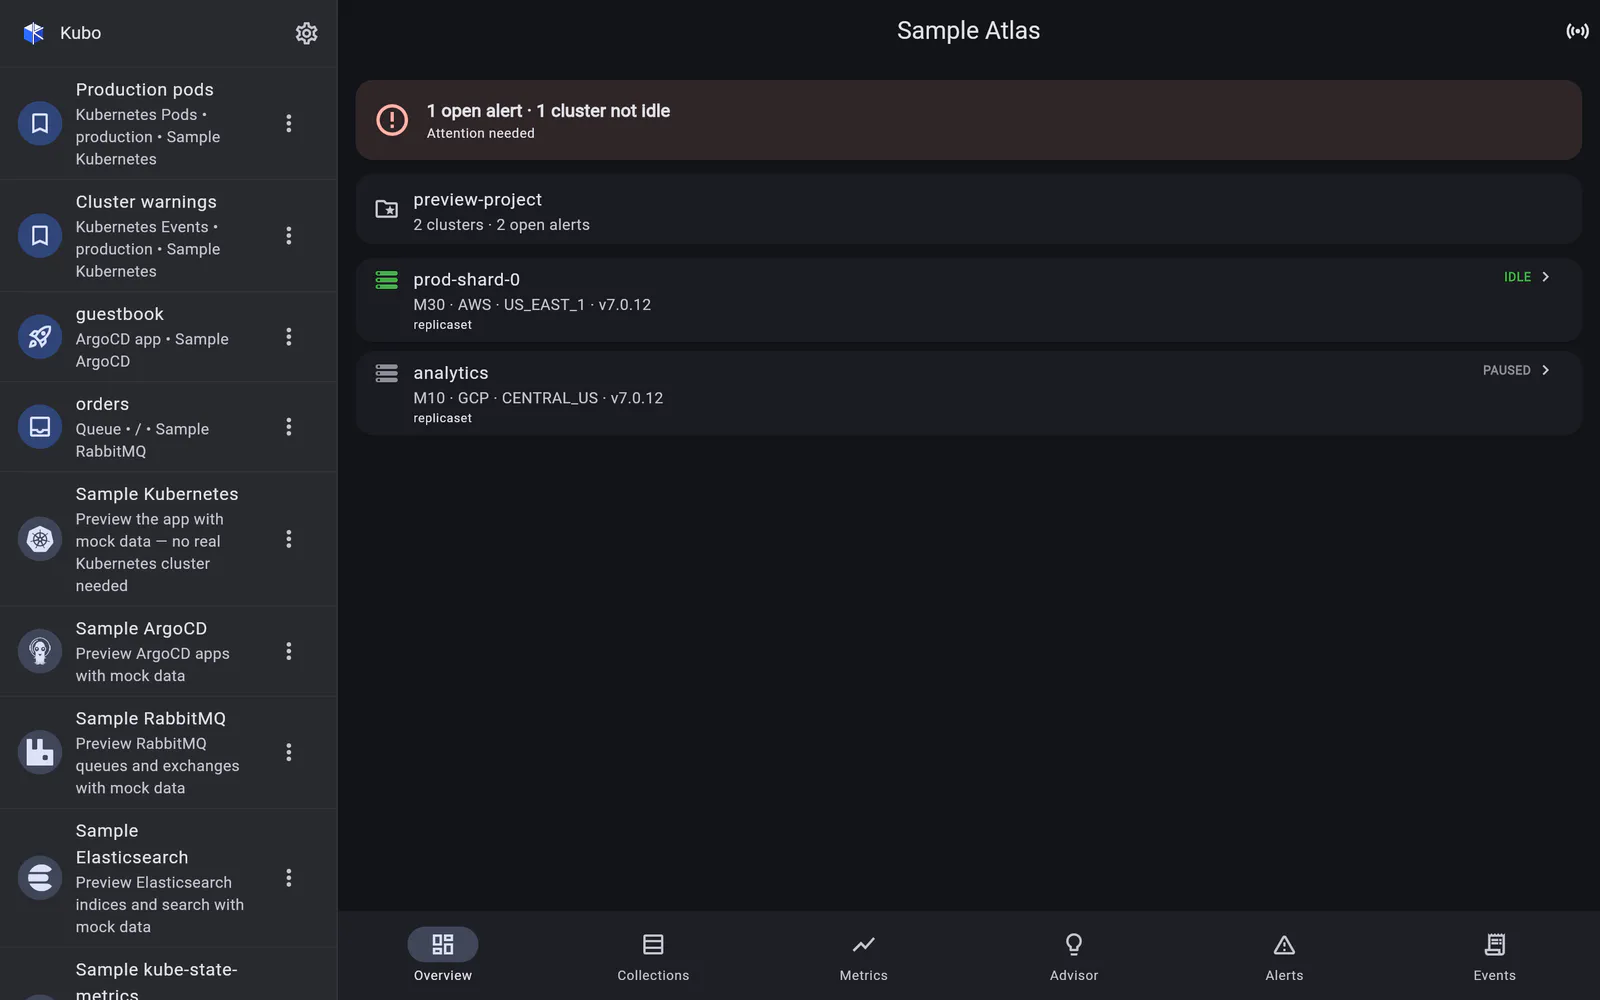
An Atlas connection monitors one project through the MongoDB Atlas Administration API v2. One programmatic key scoped to a project reaches many clusters and processes, so the project is the connection: project id, credentials, and optional base-URL or CA overrides. It opens with six sections — Overview · Collections · Metrics · Advisor · Alerts · Events — with clusters reached from the Overview rather than a tab of their own.
Two auth modes, because Atlas has two
- a programmatic API key, authenticated with self-contained HTTP Digest. Atlas API keys use Digest, not Basic or Bearer — the hash implementation is unit-tested against the RFC 2617 example vector;
- a service account, authenticated with OAuth2 client credentials — client id and secret exchanged for a short-lived bearer token, cached, refreshed before expiry and re-minted on a 401.
Either way the credentials are stored as one reusable credential in the
credentials manager, and every request carries the versioned
Accept: application/vnd.atlas.<date>+json media type Atlas requires.
Polling
The Administration API has no watch endpoint, so the lists, the overview and the measurements poll while live updates are on, plus pull-to-refresh.
In detail
Metrics
Real historical time series per process, disk and database — plus an ad-hoc picker for anything else in the catalogue.
Read →Performance Advisor & collections
Suggested indexes, parsed slow queries and enriched hot namespaces — each deep-linking to a page about one collection.
Read →Clusters, alerts & events
Cluster configuration, backup snapshots and search indexes — plus the project's alert list and activity feed.
Read →