
Metrics
Real historical time series per process, disk and database — plus an ad-hoc picker for anything else in the catalogue.
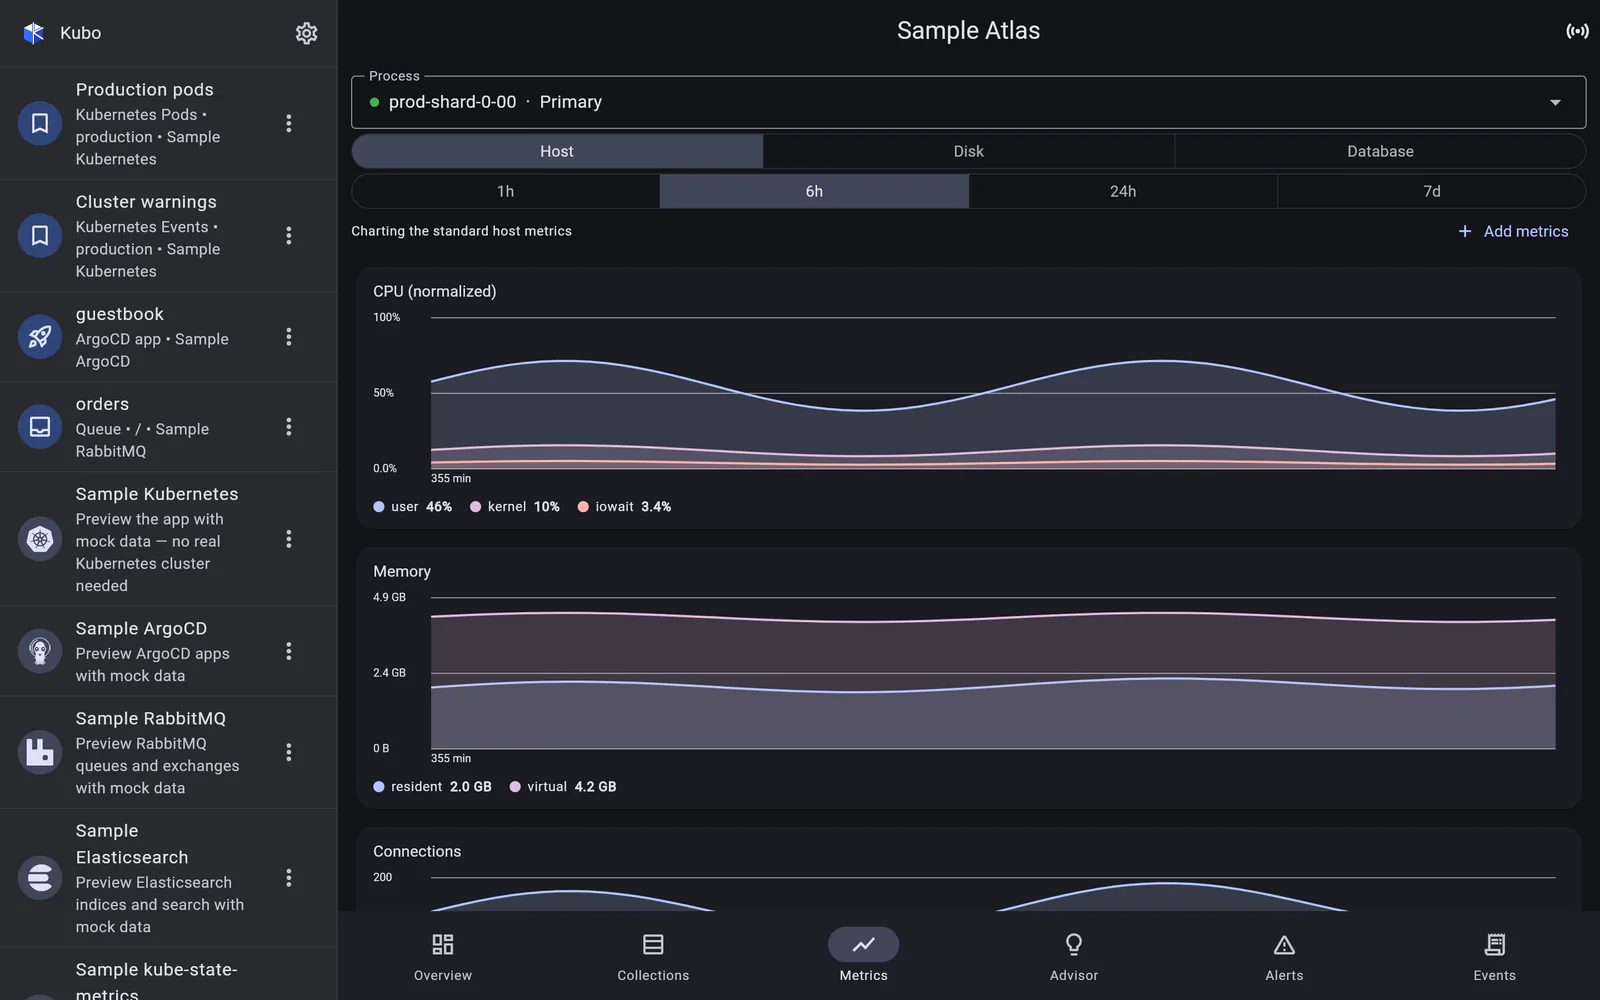
This is the section that separates Atlas from the snapshot-based connections. Where
kube-state-metrics and RabbitMQ hand back a
current-state scrape, Atlas returns real historical time series in a single call —
/processes/{id}/measurements with a granularity and a period.
So there is no in-app history store here, and no “collecting history…” state: pick a process and a range (1h / 6h / 24h / 7d) and the charts are simply there, back to where the range starts.
What is charted
The process metric groups cover what you would actually open a monitoring tab for:
- CPU and memory,
- connections,
- operations,
- network,
- query targeting — the ratio that tells you a query is scanning far more than it returns,
- WiredTiger tickets — the saturation signal that explains a stalled cluster.
Each measurement declares its own units, and those units drive the value formatting, so a number is never rendered as the wrong scale.
Scope: process, disk, database
A scope toggle charts the more targeted measurement families too:
- Disk — per-partition space, IOPS, latency and utilisation
(
/disks/{partition}/measurements); - Database — per-database storage, objects and collection counts
(
/databases/{db}/measurements),
each with its own picker for which partition or database.
Add metrics
An “Add metrics” picker charts anything else from an extended catalogue of process measurements, ad-hoc. The curated groups cover the common case; the picker means the uncommon one is not a dead end.
Back to MongoDB Atlas.