
Collections & indexes
Per-collection ops, latency and size, and index usage read from $indexStats — so an unused index is genuinely unused.
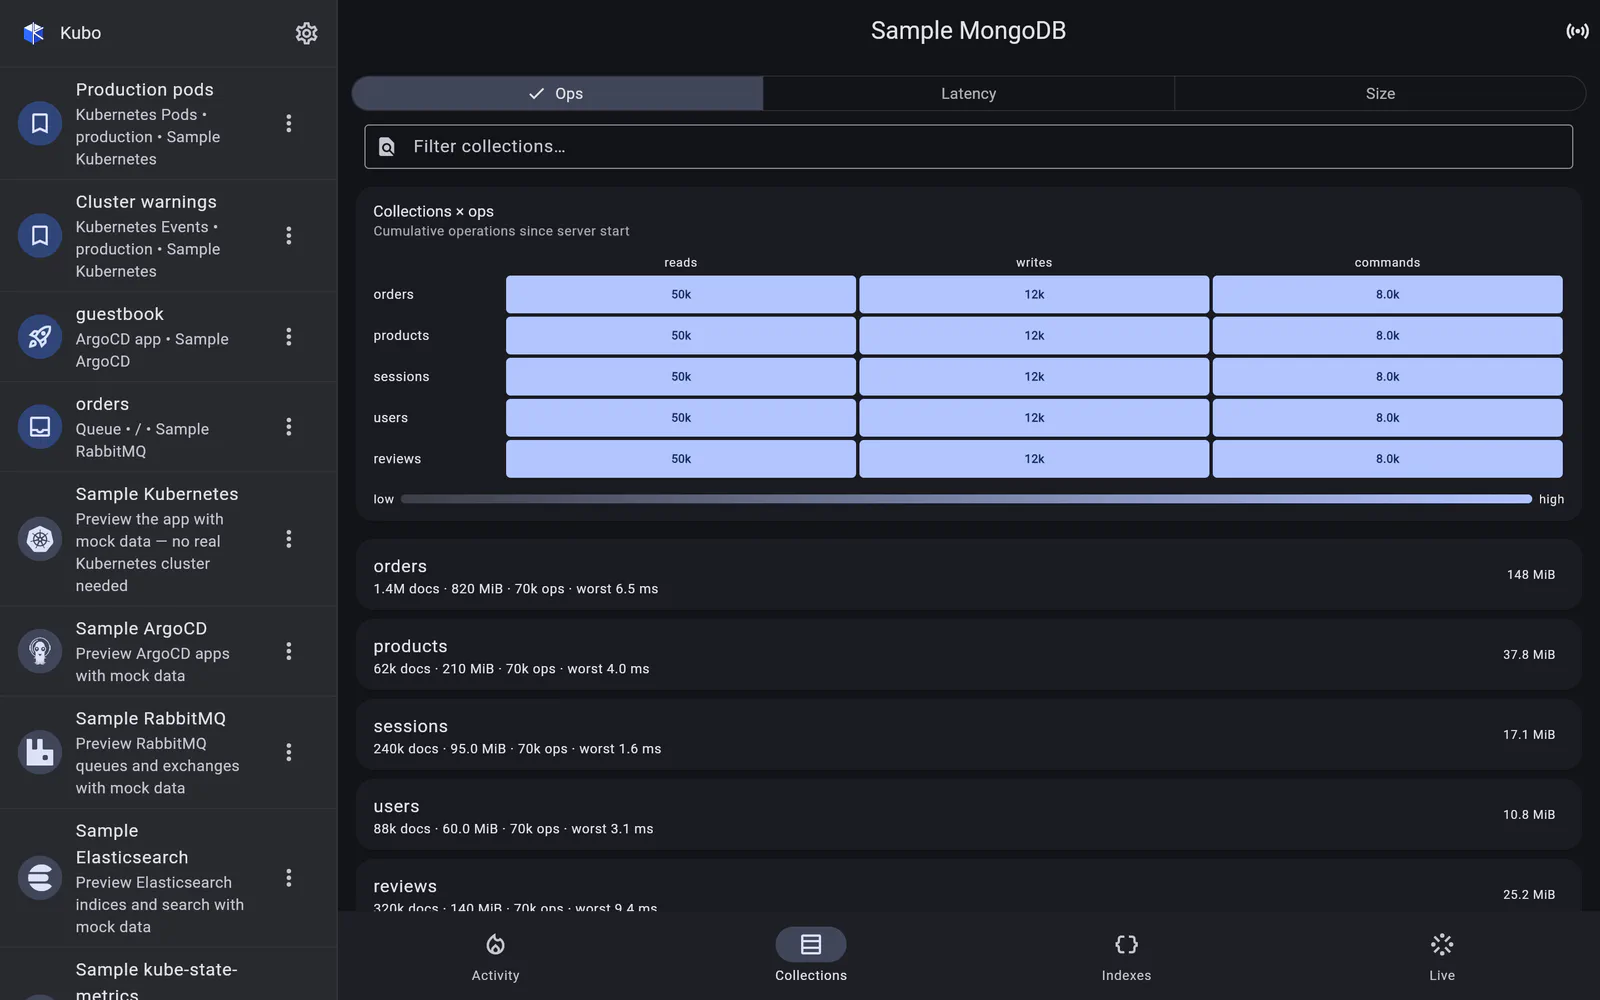
Collections
The Collections section reuses the heat grid with a metric toggle — ops,
latency or size — over a per-collection stats table underneath. The three views answer three
different questions from the same $collStats data:
- ops — what is being hit;
- latency — what is slow (the grid switches to a warm ramp for this, because slow is not a “more is better” quantity);
- size — where the storage went.
The table below carries the underlying numbers: document count, storage size, average object size, index size.
Indexes
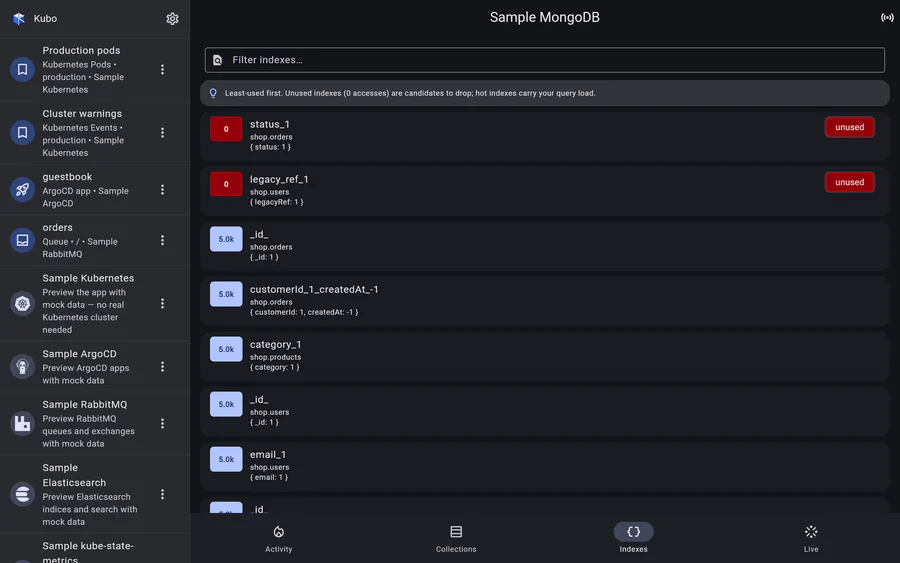
$indexStats reports accesses per index since the server started. That is a genuinely
different thing from an index advisor’s opinion: an index with zero accesses has not been
used, full stop.
So the Indexes section is a usage list sorted least-used first, with unused indexes flagged. Every index costs write throughput and storage, and the ones nobody is using are usually invisible — this is the screen that makes them visible.
Read it alongside Atlas’ suggested indexes if you run both:
Atlas tells you which index to add, $indexStats tells you which to consider dropping.
Screens
Back to MongoDB.