
OpenObserve
Logs, metrics and traces from one connection — SQL log search with a live tail, PromQL metrics, and trace waterfalls.
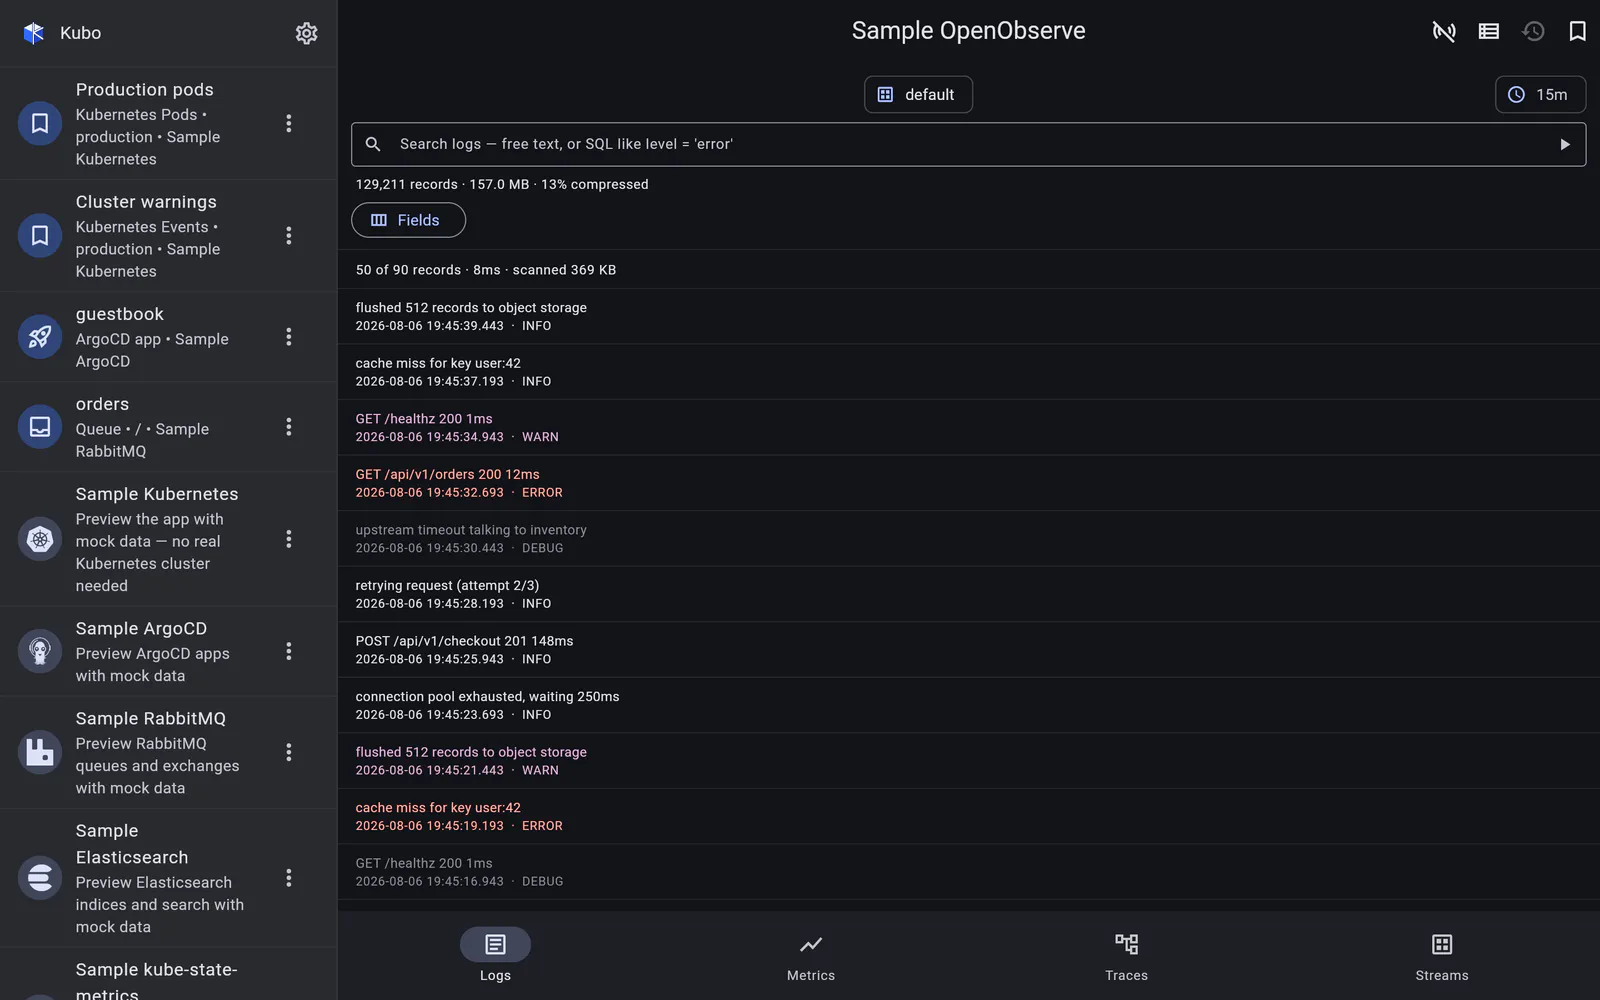
OpenObserve is the first connection in Kubo that carries all three signals at once — logs, metrics and traces — because that is how it is deployed. One instance, one organization, the whole telemetry of a system.
The organization rides on the connection
Every OpenObserve path is org-scoped (/api/{org}/…), so the organization is part of the
connection rather than something you pick per request. The add form’s Test button
doubles as org discovery: it lists the organizations your credentials can see and offers
them as chips to choose from.
Authentication is HTTP Basic (a login email and password, or an API key) or a bearer token, with the usual optional CA.
Everything is a stream of records
A log line, a metric sample and a span are the same kind of row in OpenObserve, which shapes the module: Logs and Traces are SQL searches over a stream, while Metrics is PromQL against the Prometheus-compatible endpoints — the same surface a Grafana Prometheus datasource pointed at OpenObserve would use.
Everything is time-bounded
Every request must carry an explicit microsecond window (start_time / end_time) — a
missing range is rejected outright, there is no “all time”. So one time-range picker is
shared by all three sections, and it is always visible: you are never looking at results
without knowing what window produced them.
An OpenObserve error body (a SQL parse error, say) surfaces the server’s own message rather than a bare status code.
In detail
Log search
Free text or a SQL predicate, chosen columns in three layouts, server-side sorting, filter history — and a tail that is its own cursor.
Read →Metrics
PromQL against OpenObserve's Prometheus-compatible endpoints, with the same metric and label browser.
Read →Traces
A per-trace roll-up you can actually read, and a waterfall re-treed client-side so damaged traces still render.
Read →Streams
The inventory of everything ingested — and a shortcut into the section that can query it.
Read →