
Metrics
PromQL against OpenObserve’s Prometheus-compatible endpoints, with the same metric and label browser.
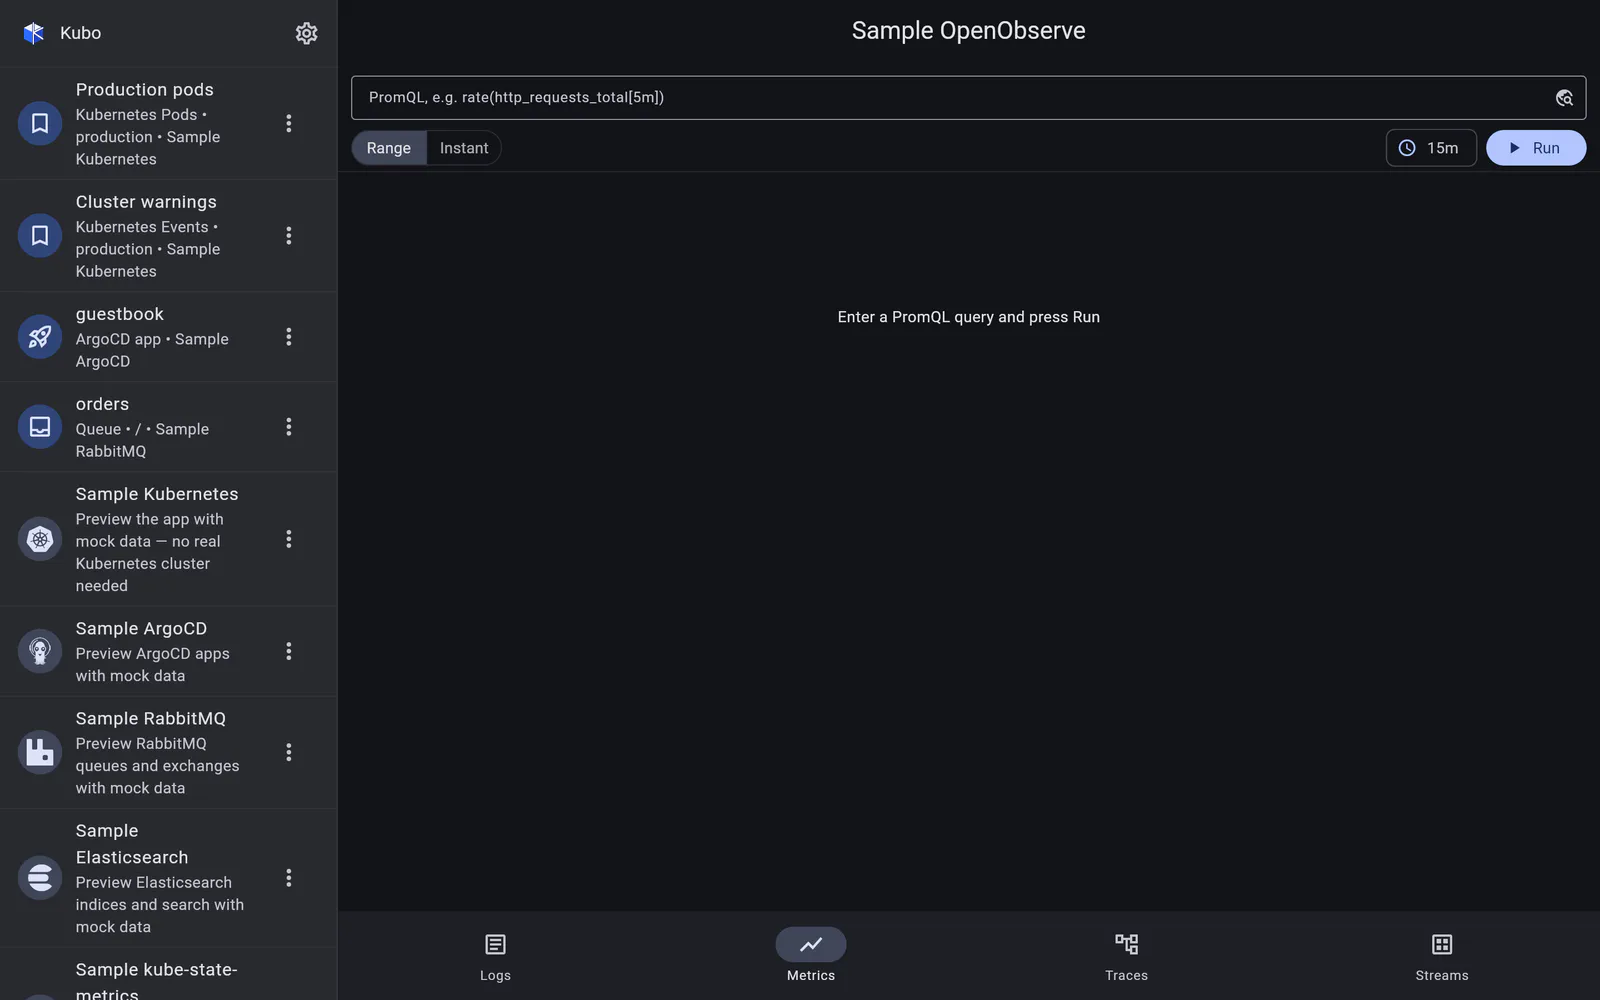
OpenObserve exposes Prometheus-compatible endpoints under /api/{org}/prometheus/api/v1/…
— the same surface a Grafana Prometheus datasource would talk to. So the Metrics section is
a PromQL explorer: instant or range, run on submit.
A metric and label browser modal discovers metric names and label="value" matchers and
appends them to the query. Typing a metric name on a phone is exactly what is worth
avoiding, and here it is doubly so — the metric names in an OpenObserve org are whatever
your pipelines happened to ingest.
Range results render with the shared time-series chart (capped at eight charted series, so a wide query stays legible), and the table beneath lists all of them with their labels and values.
Why this is the same code as Prometheus
The Prometheus HTTP API v1 result parsing lives in a shared layer rather than inside the
Prometheus module, so both connections decode {status, data} responses, matrix and vector
results the same way, and both render on the same chart. Two modules, no coupling between
them, one behaviour to learn.
Back to OpenObserve.