
Traces
A per-trace roll-up you can actually read, and a waterfall re-treed client-side so damaged traces still render.
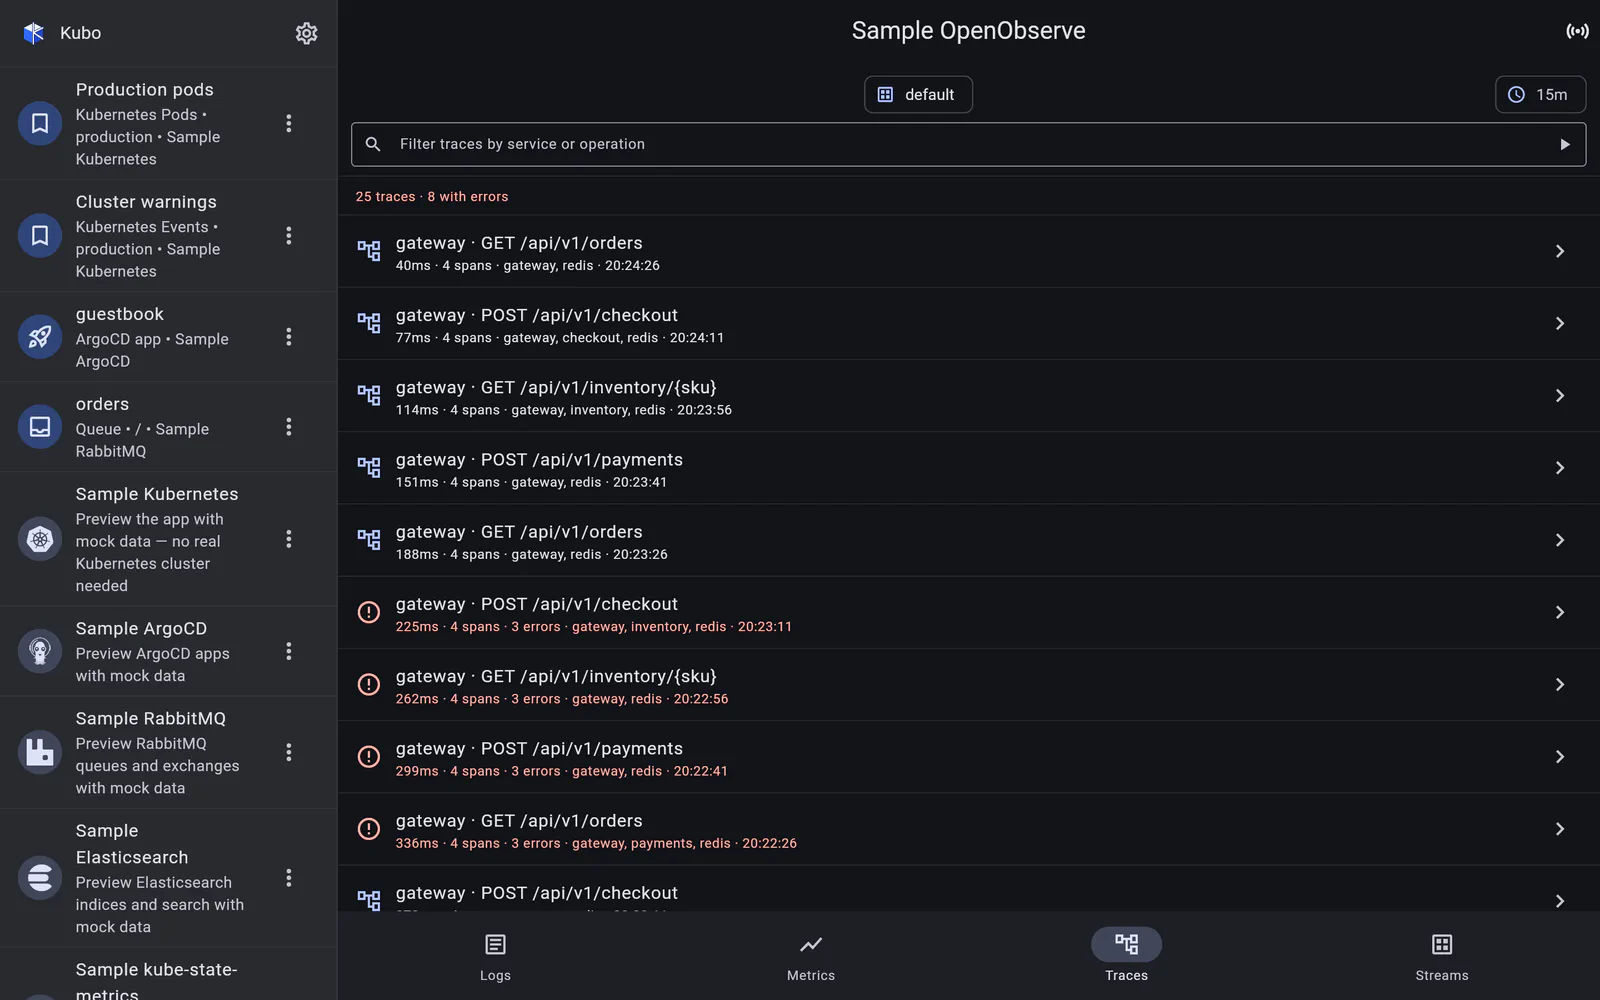
The list
A raw span list is unreadable on a phone, so the trace list uses OpenObserve’s per-trace_id
roll-up endpoint, which reports the things that make a trace list scannable:
- total duration;
- span count and error count;
- the services involved, with how many spans each contributed;
- the root operation.
It polls while live updates are on, so a trace that happens while you are looking shows up.
The waterfall
Tapping a trace reads its spans back with an ordinary search on trace_id and lays them
out as a waterfall: bars on one shared time axis, offset and width taken from each
span’s own start and end, so you can see where the time actually went rather than reading a
list of durations. Any span opens its full record, attributes included.
Re-treeing spans, safely
The spans come back as a flat list, so the parent/child tree has to be rebuilt in the app. That code is pure and unit-tested, and it is written to survive real-world damage:
- a span whose parent was never ingested becomes a root, rather than vanishing;
- a parent cycle cannot loop the layout;
- every span appears exactly once.
A trace you look at during an incident is exactly the trace most likely to be incomplete — losing spans silently would be the worst possible failure mode.
Back to OpenObserve.