
Prometheus
A PromQL explorer with a metric and label browser, plus alerts, rules and scrape targets.
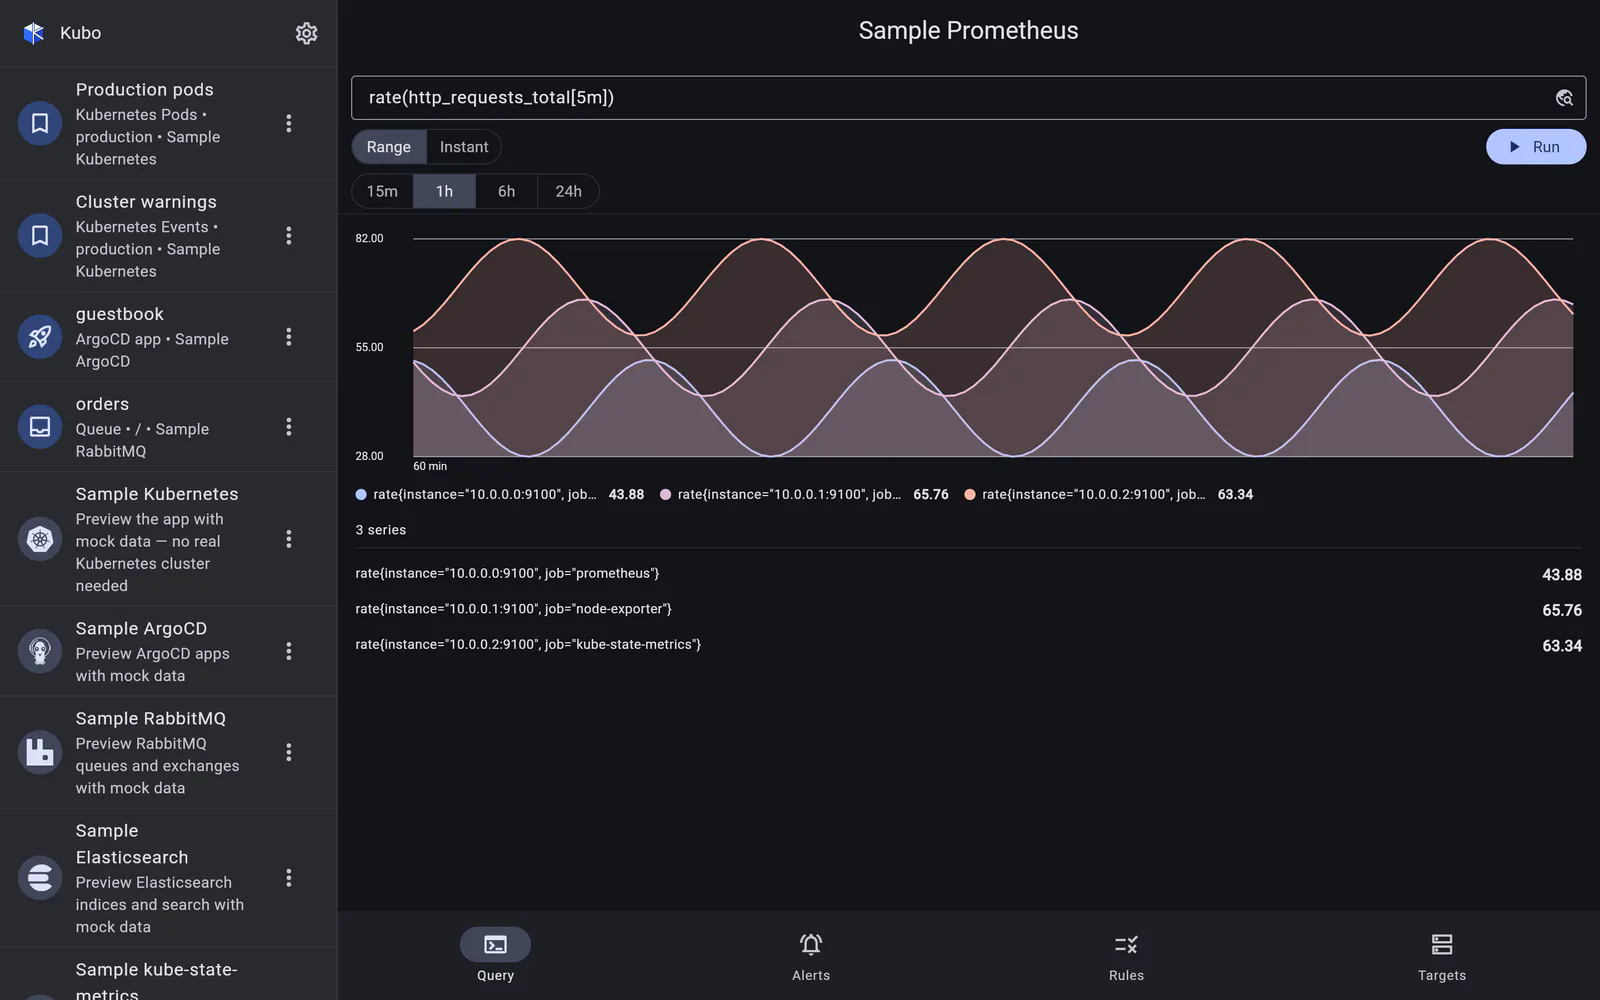
Prometheus is its own platform — it scrapes node exporters, cAdvisor, kube-state-metrics and your applications, and evaluates alerting rules — so here it is a top-level connection, not a history backend bolted onto something else. Add it with a server URL, optional bearer-token or HTTP Basic auth and an optional CA, and it opens as its own screen with four sections: Query · Alerts · Rules · Targets.
Because you can query kube_* series here with real history, this also covers the
“kube-state-metrics over time” case without coupling the two.
Errors that say what is wrong
Prometheus wraps every response in a {status, data} envelope. A status: "error" body — a
PromQL parse error, say — is turned into a typed exception carrying Prometheus’ own
message, so a typo tells you where the typo is instead of returning a bare 400.
In detail
The query explorer
Instant or range PromQL, charted without a charting library — and a metric browser so you tap a query rather than type it.
Read →Alerts & rules
What is firing right now, and the recording and alerting rules behind it.
Read →Scrape targets
Up/down health, last scrape and the error text — sorted down-first, because that is the list you came for.
Read →