
The query explorer
Instant or range PromQL, charted without a charting library — and a metric browser so you tap a query rather than type it.
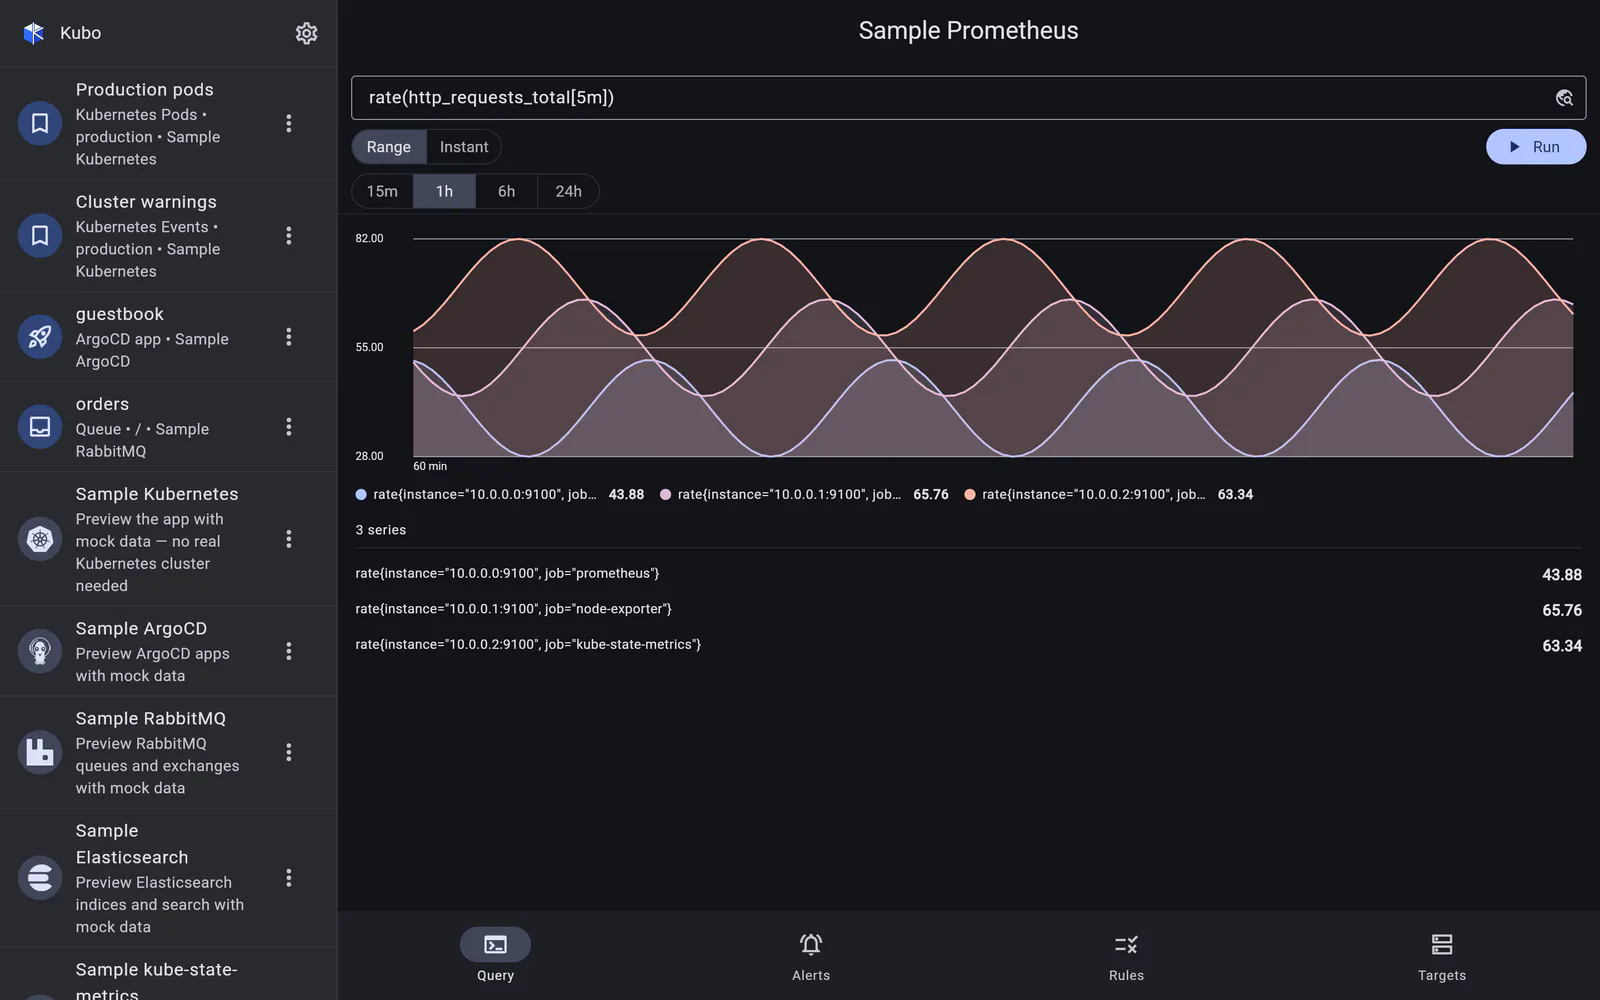
Instant and range
A query runs as either an instant query (one value per series, right now) or a range query over a window with a step. Range results render as a multi-series time-series chart; instant and scalar results render as a table of labels to values.
Queries run on submit, never per keystroke — a phone keyboard would otherwise fire a dozen expensive range queries on the way to a valid expression.
The metric & label browser
This is the part that makes PromQL usable without a keyboard. A modal, backed by
/api/v1/label/__name__/values and /api/v1/labels, lets you:
- search the metric names the server actually has, and append one to the query;
- search label names and values, and append a
label="value"matcher.
So sum by (pod) (rate(container_cpu_usage_seconds_total{namespace="production"}[5m]))
is mostly taps, and — more importantly — you find out what the series is called without
switching to a laptop.
The chart
Charts are drawn by a custom painter rather than a charting library, which has one very practical consequence: they inherit the app’s active skin — light, dark, neon — instead of carrying a library’s own palette. Series are capped at a sensible number for a small screen, with the full label-to-value table listed below the chart.
Back to Prometheus.