
Scrape targets
Up/down health, last scrape and the error text — sorted down-first, because that is the list you came for.
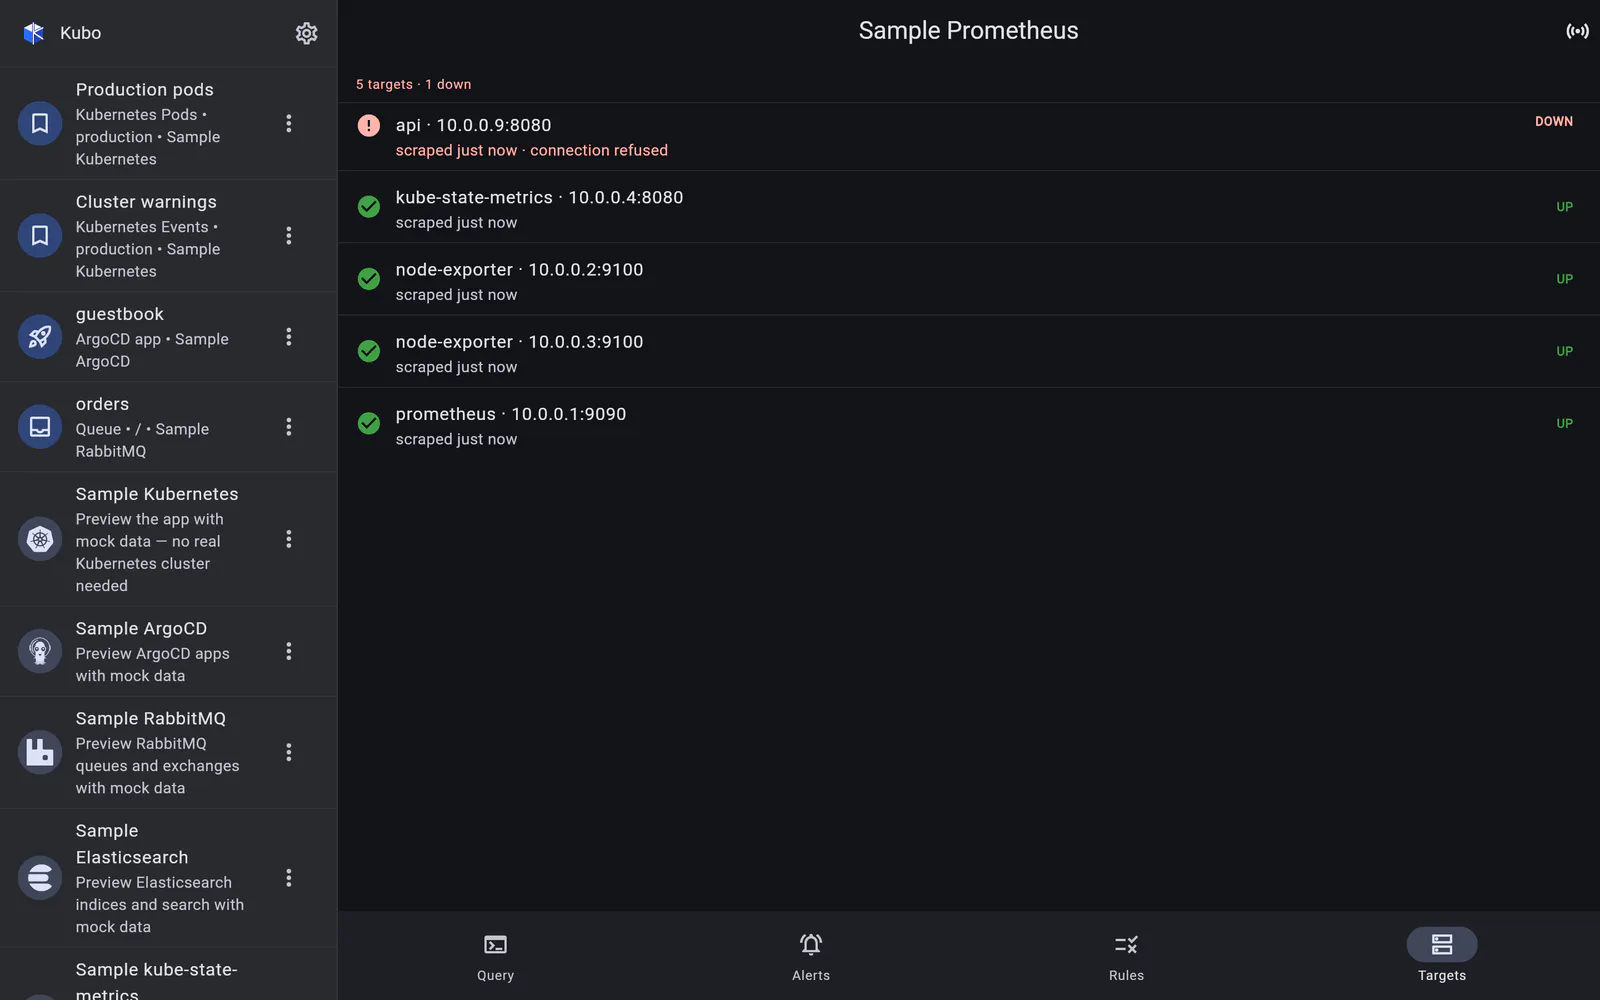
/api/v1/targets is the least glamorous screen here and often the most useful. When a
dashboard goes flat, the question is rarely “what does this metric mean” — it is “did
Prometheus stop scraping the thing”.
Each target shows:
- health — up or down;
- the scrape URL and its job and instance labels;
- last scrape time and duration;
- the error text when it is down, verbatim from Prometheus.
Down targets sort first. A healthy cluster shows a wall of green you never scroll through; an unhealthy one puts the answer on the first line.
Targets poll while live updates are on, plus pull-to-refresh — so you can watch a target come back after a restart rather than guessing.
Back to Prometheus.