
RabbitMQ
Queues, exchanges, connections and nodes over the Management API — with history charts and safe actions like purge and force-close.
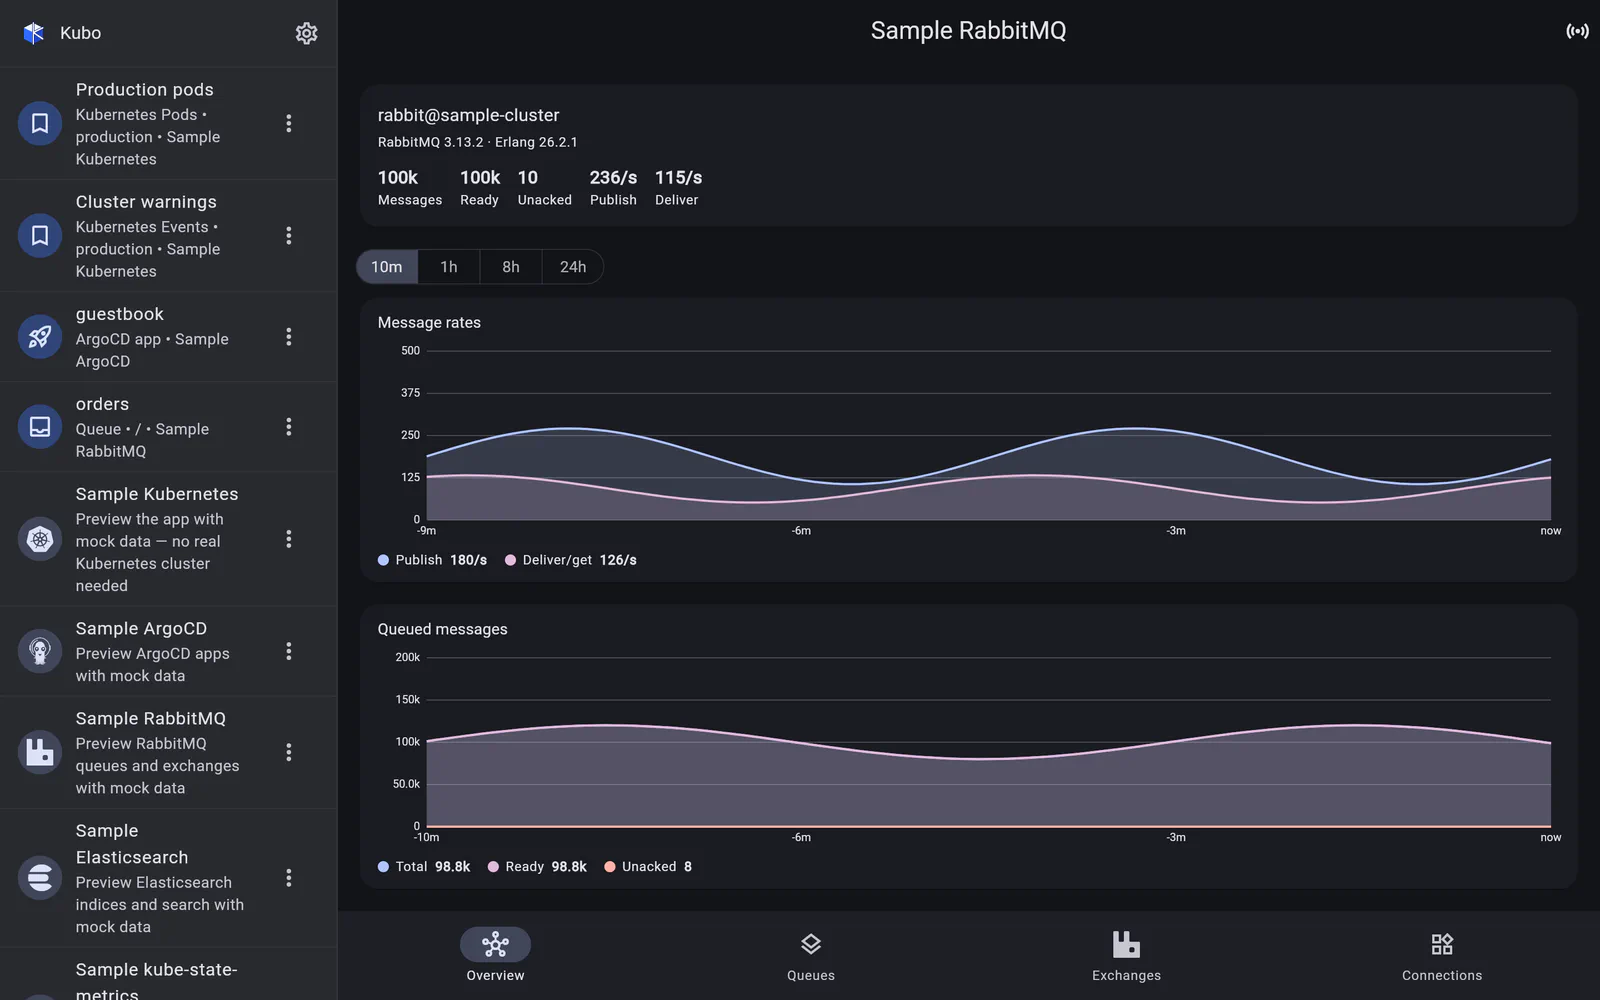
A RabbitMQ server is a top-level connection — management URL (default port 15672),
username and password, optional CA — because one broker manages many vhosts. It opens as
its own screen with four sections: Overview + Nodes, Queues, Exchanges and
Connections.
Polling, because there is no stream
The Management API has no watch or stream endpoint, so the lists poll: an initial fetch and a periodic re-fetch while live updates are on (an app-bar toggle), plus pull-to-refresh. That is stated plainly rather than dressed up as “real-time”, because the difference matters when you are watching a queue drain.
Overview and nodes
The Overview section reports broker and per-node health — memory and disk alarms, file descriptors, socket use, partitions — above the history charts that make it worth looking at.
In detail
Queues
Depths and rates per queue with a vhost filter and search, a detail page with bindings, and purge or delete behind a confirm.
Read →Exchanges & connections
Exchanges with their bindings, and client connections you can force-close when one goes rogue.
Read →History charts
Real broker-side history, drawn from sample arrays the Management API only returns if you ask for them properly.
Read →