
Traffic
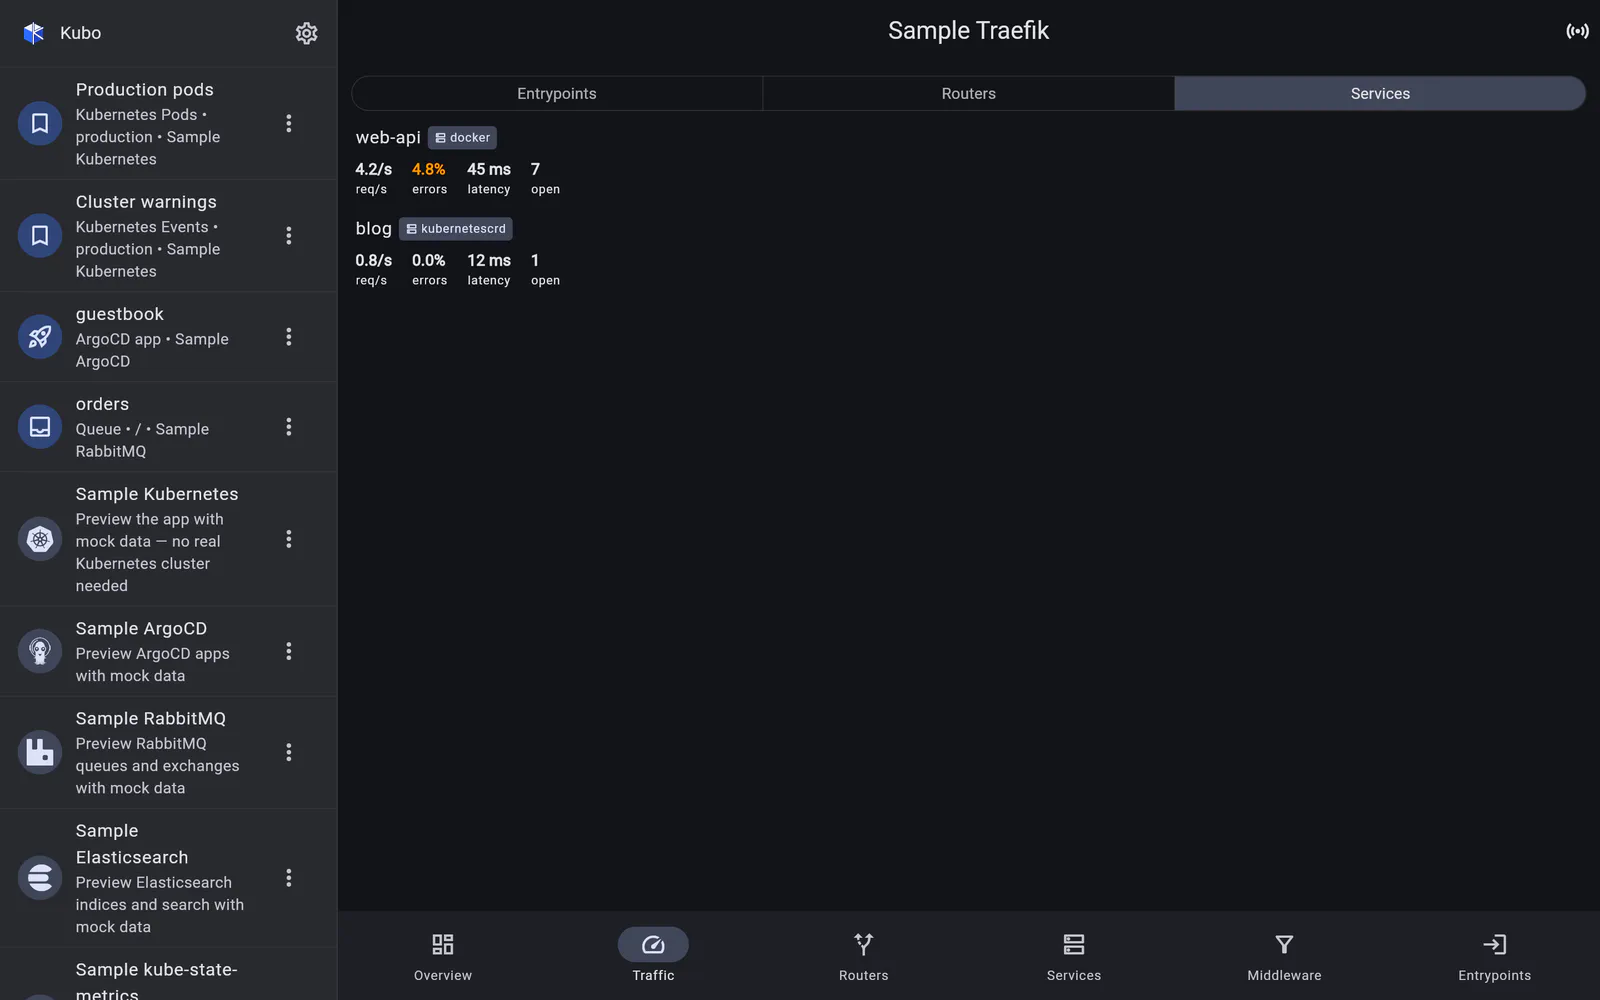
Request rate, error percentage, latency and open connections — differenced from two scrapes of Traefik’s Prometheus endpoint.
Traefik exposes no per-request API and no traffic stream. The only near-real-time signal it
publishes is its Prometheus /metrics endpoint — so that is what the Traffic section
uses.
How the numbers are made
Kubo scrapes the text exposition format (with the same parser the kube-state-metrics module uses), aggregates the relevant cumulative counters per object —
traefik_{entrypoint,router,service}_requests_total, plus thecodelabel for errors,_request_duration_seconds_sumand_count,_open_connections,
— and then differences two consecutive scrapes. That difference is what produces:
- per-second request rate;
- error percentage;
- average latency (duration sum over count, across the window);
- live open connections (a gauge, so it is read directly).
A segmented toggle groups all of it by entry point, router or service — the same number seen from three angles: which port is busy, which route is busy, which backend is busy.
Because rates come from differencing, the first scrape after opening the screen shows counters only; the numbers appear once the second one lands.
Where the metrics live
The metrics endpoint defaults to <serverUrl>/metrics, but in most real deployments metrics
are exposed on a separate entry point or port — so a connection can set a Metrics URL
override.
If the endpoint 404s, the screen says what to do — enable metrics.prometheus, or set a
Metrics URL — rather than showing a generic error. A missing optional feature should read
like a missing optional feature.
Back to Traefik.