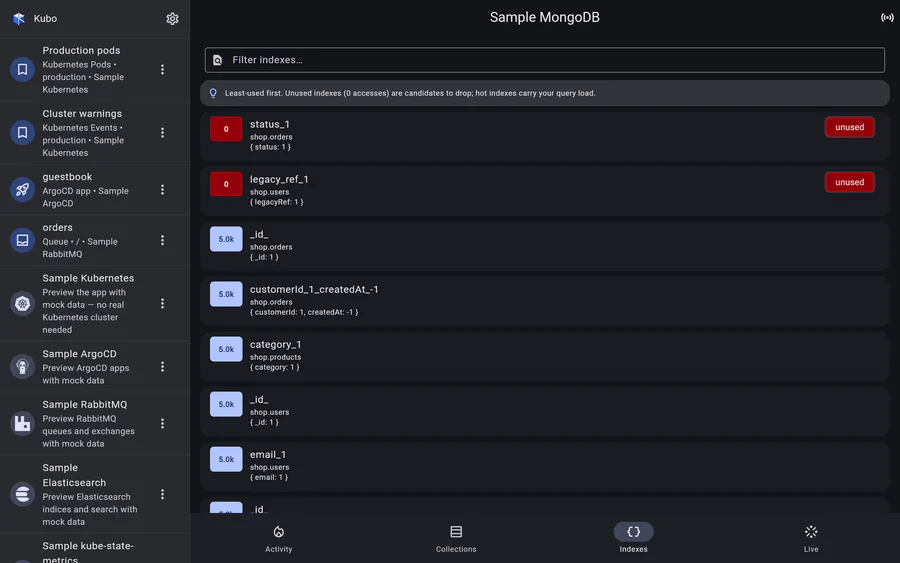
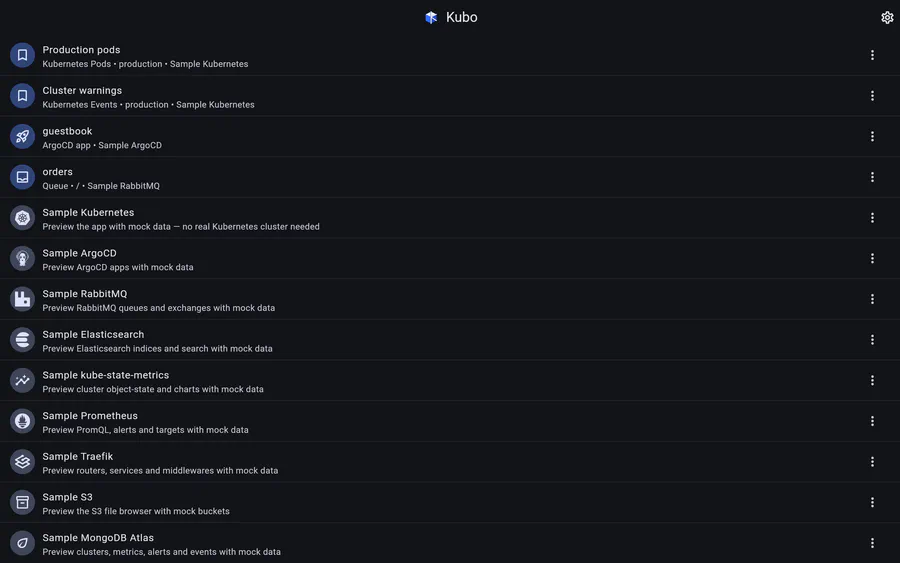
Every screen in the app, captured from the built-in sample connections. Tap any image to open it full size.
None of these are mock-ups. Each one is the real app running against its built-in
sample connections — the same mock cluster, broker and endpoints you get by switching
a sample on. Most are shown at desktop width so the detail is legible; the app looks like
this on a phone too, as the home page strip shows.
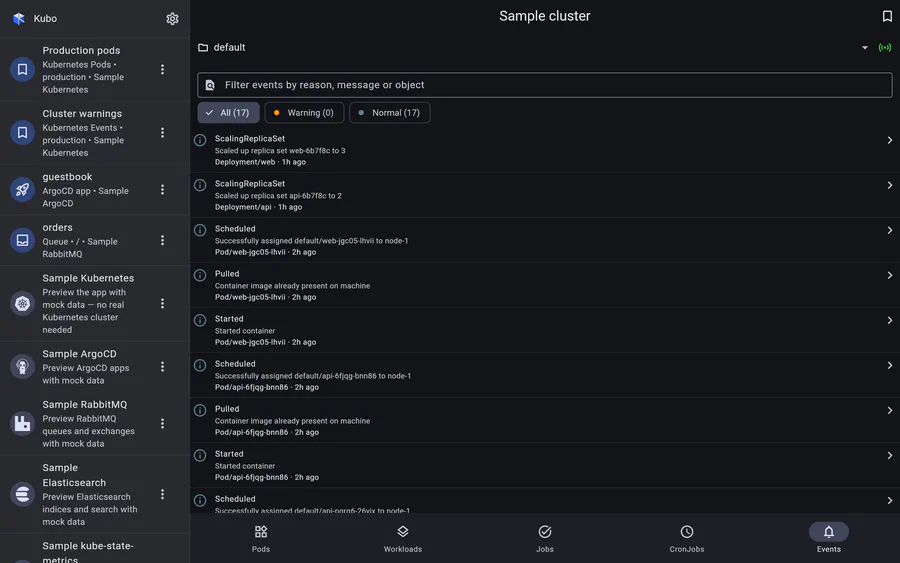
Pods, workloads, jobs, cronjobs, services and events — live over the watch API, with the actions you actually need on call.
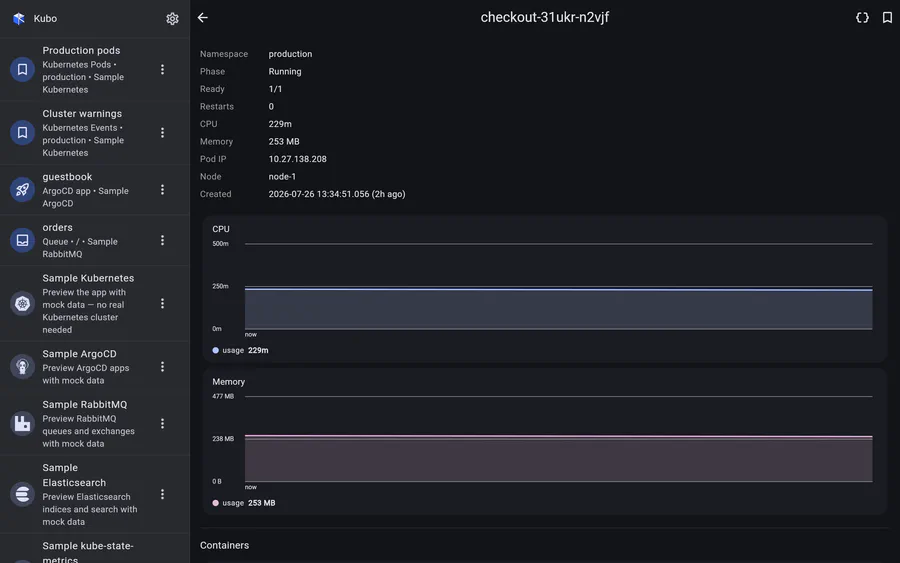
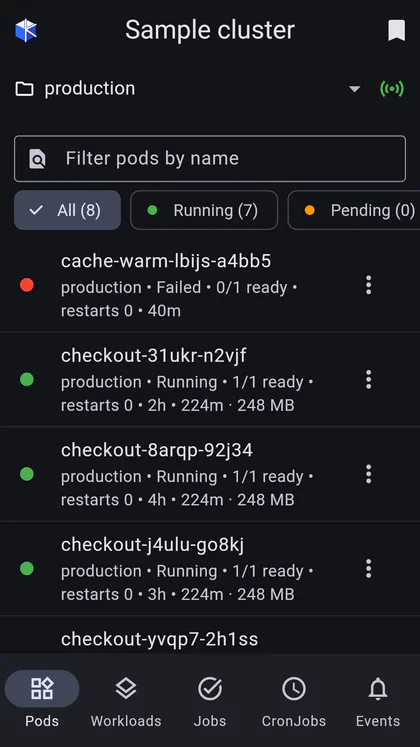
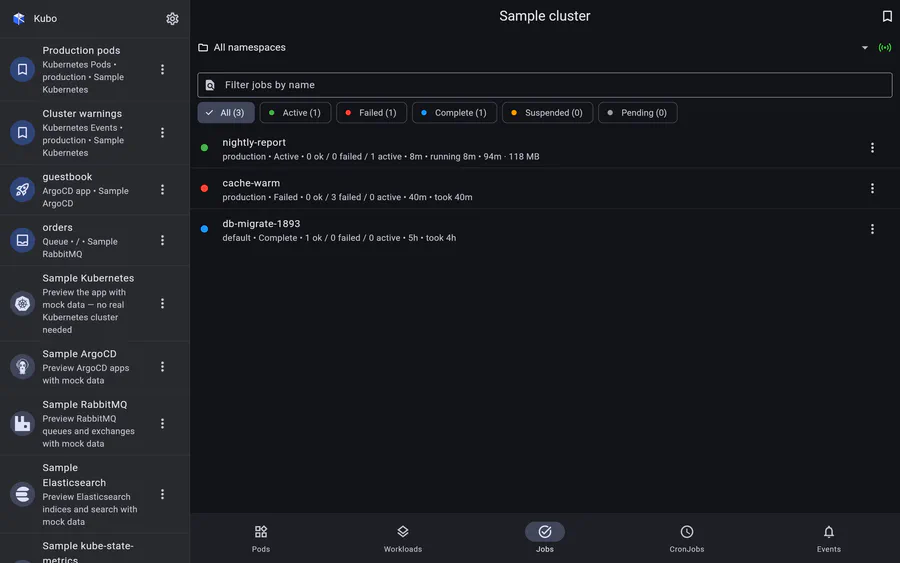
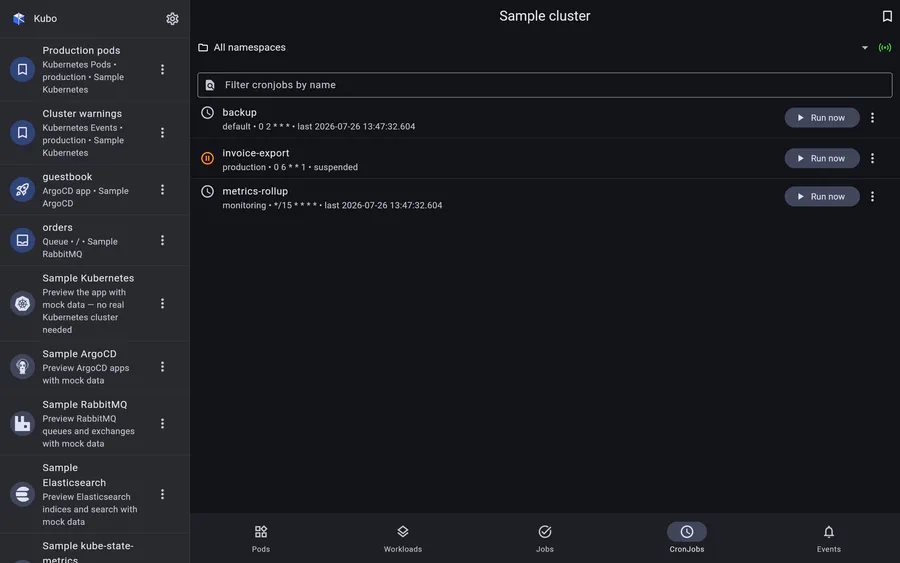
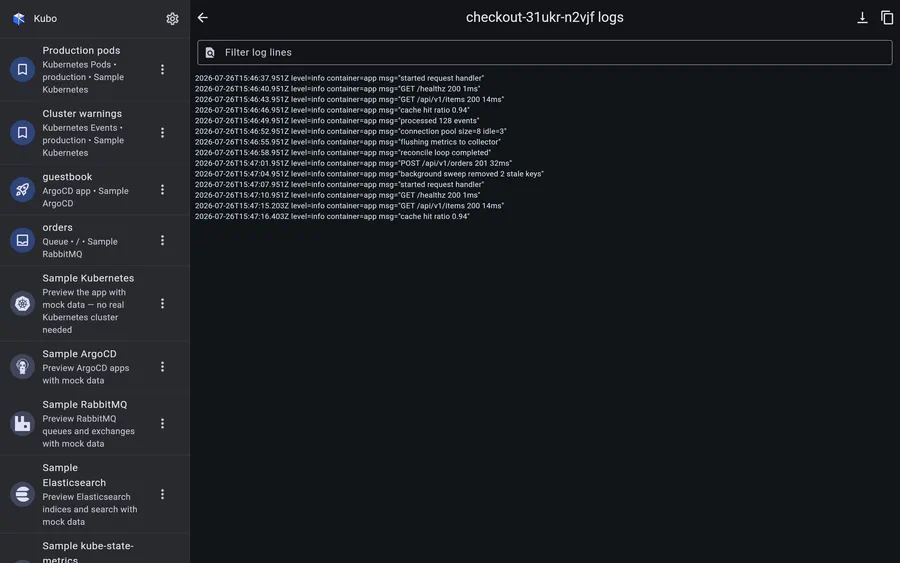
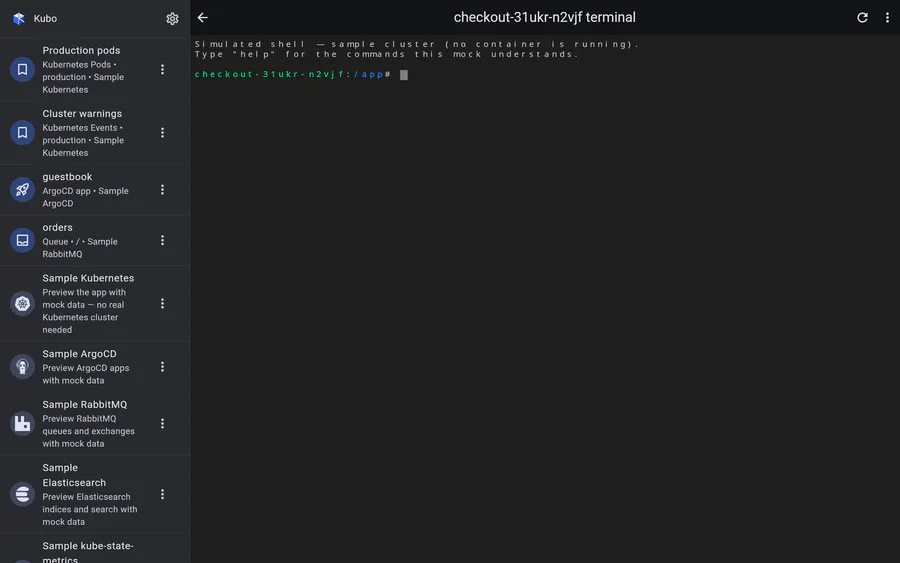
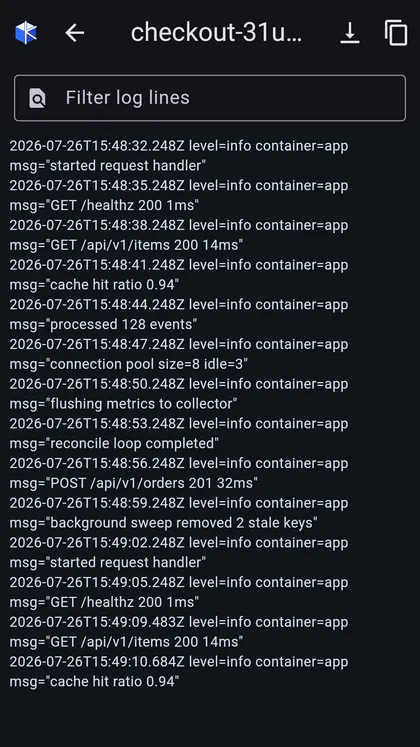
Pod detailContainers, conditions, live CPU/memory charts and the pod’s events, newest first.On a phoneThe same list at phone width — facets wrap, usage stays on the row.JobsNewest first, with a status facet, age and run duration, suspend/resume and cascade delete.CronJobsTrigger a manual run from the job template, or suspend and resume the schedule.Events tabNamespace-scoped or cluster-wide, live over the watch API, with free-text search over reason, message and object.Pod logsFilter, match count, copy-visible and a container picker for multi-container pods.TerminalAn interactive shell in a container. Shown here against the sample cluster’s simulated shell, which is why it says no container is running.On a phoneThe same viewer at phone width — the chrome is shared by the pod, workload and ArgoCD log screens.